Unlock a world of possibilities! Login now and discover the exclusive benefits awaiting you.
- Qlik Community
- :
- All Forums
- :
- QlikView App Dev
- :
- How to accumulate values when having multiple dime...
- Subscribe to RSS Feed
- Mark Topic as New
- Mark Topic as Read
- Float this Topic for Current User
- Bookmark
- Subscribe
- Mute
- Printer Friendly Page
- Mark as New
- Bookmark
- Subscribe
- Mute
- Subscribe to RSS Feed
- Permalink
- Report Inappropriate Content
How to accumulate values when having multiple dimensions?
Hi Community,
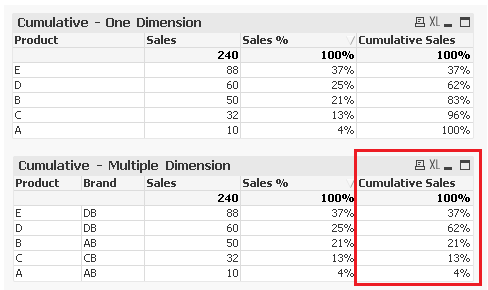
I would like to seek help from you if there are possibilities to accumulate values when having multiple dimensions in a straight table? This is a client requirement which I pretty need to address the concern. Find below the sample chart, I highlighted the column where it does not worked, even using Full Accumulation.
Attached herewith is the sample application used in the provided chart above.
NOTE: Seems like the accumulative will only work in having one dimension. Hope there is workaround for multiple dimensions.
Regards,
Bill
Accepted Solutions
- Mark as New
- Bookmark
- Subscribe
- Mute
- Subscribe to RSS Feed
- Permalink
- Report Inappropriate Content
Hi,
Try expression as
Rangesum(Above(TOTAL Sum(Sales),0,RowNo(TOTAL)))/Sum(TOTAL Sales)
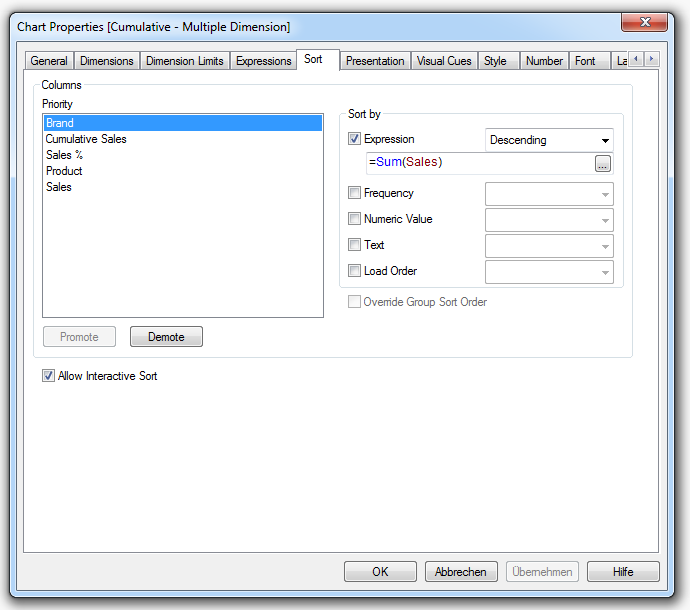
Sort expression for product dimension as
=Aggr(Rank(TOTAL Sum(Sales)),Product,Brand)
- Mark as New
- Bookmark
- Subscribe
- Mute
- Subscribe to RSS Feed
- Permalink
- Report Inappropriate Content
See this:
- Mark as New
- Bookmark
- Subscribe
- Mute
- Subscribe to RSS Feed
- Permalink
- Report Inappropriate Content
Hi,
Try expression as
Rangesum(Above(TOTAL Sum(Sales),0,RowNo(TOTAL)))/Sum(TOTAL Sales)
Sort expression for product dimension as
=Aggr(Rank(TOTAL Sum(Sales)),Product,Brand)
- Mark as New
- Bookmark
- Subscribe
- Mute
- Subscribe to RSS Feed
- Permalink
- Report Inappropriate Content
Hi Tamil,
Thanks for the help. Would also like to ask how can I sort the report by Sales %? I modified the data a little, there are product with same brand but different supplier. But what should be displayed in the report is sorted by Sales % per Brand, regardless of the supplier.
What is currently happening is that it is sorted per Brand, per Supplier.
I cannot able to attach the updated sample application with updated inline data. Find below the updated inline data.
Data_tmp1:
Load * Inline [
Product, Brand, Supplier, Sales
A, AB, ABC, 10
B, AB, ABC, 50
C, CB, CDE, 32
D, DB, ABC, 60
E, DB, DEF, 88,
A, DB, HJI, 28
];
- Mark as New
- Bookmark
- Subscribe
- Mute
- Subscribe to RSS Feed
- Permalink
- Report Inappropriate Content
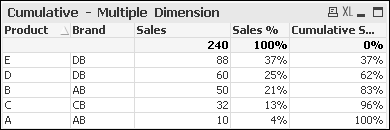
Like this?
| Product | Brand | Sales | Sales % | Cumulative Sales |
|---|---|---|---|---|
| 268 | 100% | 0% | ||
| A | AB | 10 | 4% | 4% |
| B | AB | 50 | 19% | 22% |
| A | DB | 28 | 10% | 33% |
| E | DB | 88 | 33% | 66% |
| D | DB | 60 | 22% | 88% |
| C | CB | 32 | 12% | 100% |
Then just go to sort tab and promote the Brand column to the top.
edit:
Missed that you want to sort by Sum(Sales):
| Product | Brand | Sales | Sales % | Cumulative Sales |
|---|---|---|---|---|
| 268 | 100% | 0% | ||
| A | DB | 28 | 10% | 10% |
| E | DB | 88 | 33% | 43% |
| D | DB | 60 | 22% | 66% |
| A | AB | 10 | 4% | 69% |
| B | AB | 50 | 19% | 88% |
| C | CB | 32 | 12% | 100% |
- Mark as New
- Bookmark
- Subscribe
- Mute
- Subscribe to RSS Feed
- Permalink
- Report Inappropriate Content
Hi swuehl,
It should be sorted by Sales % of Product, the brand must be disregarded. So the result would be descending order of Sales %. How would it possible?
- Mark as New
- Bookmark
- Subscribe
- Mute
- Subscribe to RSS Feed
- Permalink
- Report Inappropriate Content
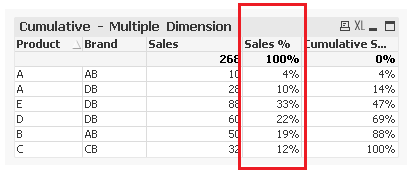
Do you want Sales % shown in descending order or do you want sales % of product? That's a difference in your chart.
edit:
Maybe like this?
| Product | Brand | Sales | Sales % | Cumulative Sales |
|---|---|---|---|---|
| 268 | 100% | 0% | ||
| E | DB | 88 | 33% | 33% |
| D | DB | 60 | 22% | 55% |
| B | AB | 50 | 19% | 74% |
| C | CB | 32 | 12% | 86% |
| A | DB | 28 | 10% | 96% |
| A | AB | 10 | 4% | 100% |
- Mark as New
- Bookmark
- Subscribe
- Mute
- Subscribe to RSS Feed
- Permalink
- Report Inappropriate Content
Hello Bill,
Create a calculated dimension as =Aggr(Rank(TOTAL Sum(Sales)),Product,Brand) and name it as "Rank" or something. Now, go to the sort tab and promote the Rank dimension to top. Also, make sure the Sort by should be Numeric values and Ascending order is selected. I have attached sample file for reference.

- Mark as New
- Bookmark
- Subscribe
- Mute
- Subscribe to RSS Feed
- Permalink
- Report Inappropriate Content
tamilarasu this is amazing! Thank you for sharing. It works in my application.