Unlock a world of possibilities! Login now and discover the exclusive benefits awaiting you.
Announcements
Independent validation for trusted, AI-ready data integration. See why IDC named Qlik a Leader: Read the Excerpt!
- Qlik Community
- :
- All Forums
- :
- QlikView App Dev
- :
- How to add colours ?
Options
- Subscribe to RSS Feed
- Mark Topic as New
- Mark Topic as Read
- Float this Topic for Current User
- Bookmark
- Subscribe
- Mute
- Printer Friendly Page
Turn on suggestions
Auto-suggest helps you quickly narrow down your search results by suggesting possible matches as you type.
Showing results for
Creator II
2017-10-25
03:15 AM
- Mark as New
- Bookmark
- Subscribe
- Mute
- Subscribe to RSS Feed
- Permalink
- Report Inappropriate Content
How to add colours ?
The below table shows product sales .
| Header 1 | Header 2 |
|---|---|
| Product | Sales |
| Car | 100 |
| Fridge | 50 |
| Television | 200 |
| WashingMachine | 70 |
How can i achieve this ?
sales > 150 is to be shown in Green
sales < 80 is to be shown in Red ???
534 Views
4 Replies
Contributor III
2017-10-25
03:28 AM
- Mark as New
- Bookmark
- Subscribe
- Mute
- Subscribe to RSS Feed
- Permalink
- Report Inappropriate Content
Hi Ramesh
In your chart use Properties>Visual Cues like below

2017-10-25
03:29 AM
- Mark as New
- Bookmark
- Subscribe
- Mute
- Subscribe to RSS Feed
- Permalink
- Report Inappropriate Content
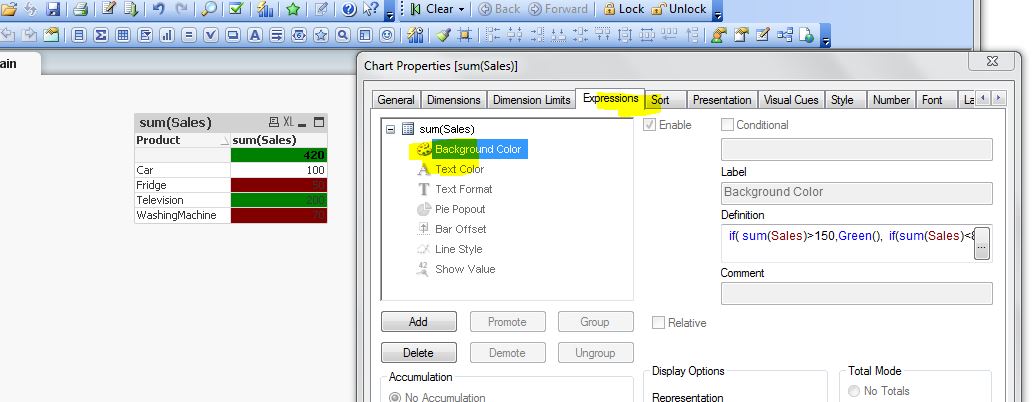
You can use BG color like
If(Sum(Sales) > 150, Green(), If(Sum(Sales) < 80, Red()))
Best Anil, When applicable please mark the correct/appropriate replies as "solution" (you can mark up to 3 "solutions". Please LIKE threads if the provided solution is helpful
Master II
2017-10-25
03:36 AM
- Mark as New
- Bookmark
- Subscribe
- Mute
- Subscribe to RSS Feed
- Permalink
- Report Inappropriate Content
Hi,
if( sum(Sales)>150,Green(), if(sum(Sales)<80,Red()))
Creator II
2017-10-25
04:23 AM
Author
- Mark as New
- Bookmark
- Subscribe
- Mute
- Subscribe to RSS Feed
- Permalink
- Report Inappropriate Content
Thank You devarasu07 R
476 Views