Unlock a world of possibilities! Login now and discover the exclusive benefits awaiting you.
- Qlik Community
- :
- All Forums
- :
- QlikView App Dev
- :
- Re: How to add column to a pivot table
- Subscribe to RSS Feed
- Mark Topic as New
- Mark Topic as Read
- Float this Topic for Current User
- Bookmark
- Subscribe
- Mute
- Printer Friendly Page
- Mark as New
- Bookmark
- Subscribe
- Mute
- Subscribe to RSS Feed
- Permalink
- Report Inappropriate Content
How to add column to a pivot table
Hi,
I made a pivot table like below (without the yellow column)
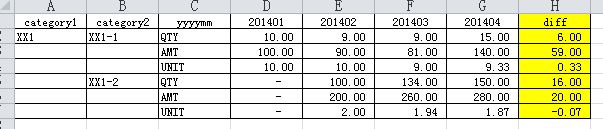
Now I want add the yellow column which value is the difference between last two month (in this case,201404 and 201403) to the right of the pivot.
Can Qlikview do this?
Thank you very much for your help.
Best regards
Wei
- Tags:
- pivot
- « Previous Replies
-
- 1
- 2
- Next Replies »
- Mark as New
- Bookmark
- Subscribe
- Mute
- Subscribe to RSS Feed
- Permalink
- Report Inappropriate Content
Add a new expression that computes what you need
- Mark as New
- Bookmark
- Subscribe
- Mute
- Subscribe to RSS Feed
- Permalink
- Report Inappropriate Content
Hi
You can use the above function, see attached qvw for an example
Regards
Richard
QlikCentral.com
- Mark as New
- Bookmark
- Subscribe
- Mute
- Subscribe to RSS Feed
- Permalink
- Report Inappropriate Content
Hi,
Try using SecondaryDimensionality , attached is the qvd.

Thanks & Regards,
MVV Satish.
- Mark as New
- Bookmark
- Subscribe
- Mute
- Subscribe to RSS Feed
- Permalink
- Report Inappropriate Content
Yes you can add its depends on your expression
like
201404 - 201403 = diff
in another column
- Mark as New
- Bookmark
- Subscribe
- Mute
- Subscribe to RSS Feed
- Permalink
- Report Inappropriate Content
COLUMN(2)-COLUMN(1) WILL GIVE THE DIFFERENCE IF U WANT THE COLOR MEAN FOR THE DIFFERENCE ROM MEAN U HAVE TO GIVE IN EXPRESSION BACKGROUND
IF(COLUMN(2)-COLUMN(1)>0,YELLOW(),WHITE())
- Mark as New
- Bookmark
- Subscribe
- Mute
- Subscribe to RSS Feed
- Permalink
- Report Inappropriate Content
Hi,
That's what I want. Thank you very much.
May I ask 2 more questions?
I saw you use this expression to define value:
=if(SecondaryDimensionality()=0,sum({<[FQ]={ $(vMaxFQ)}>}[Value])-sum({<[FQ]={ $(vMaxPrevious)}>}[Value]),
sum(Value))
I don't understand $(vMaxFQ) and $(vMaxPrevious).
And in my case qty,amt,unit is already defined by sum function, can I just replace [Value] by an expression sth like sum(qty)?
- Mark as New
- Bookmark
- Subscribe
- Mute
- Subscribe to RSS Feed
- Permalink
- Report Inappropriate Content
Hi, Satish
I modified your qvw to test how it works when there are more values in data area.
And I got the result as below.
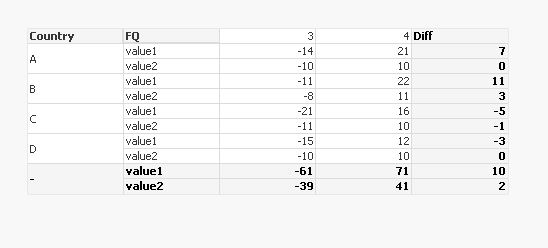
FQ1 and FQ2 are missed in this pivot and all FQ3 value are negative.
Is there any restriction when using function SecondaryDimensionality()?
Best regards
Wei
- Mark as New
- Bookmark
- Subscribe
- Mute
- Subscribe to RSS Feed
- Permalink
- Report Inappropriate Content
Hi,
vMaxFQ and vMaxPrevious are variables to get the max quarter and previous quarter, in your case you can create variables for months.
Yes you can replace Value with qty
Best Regards,
MVV Satish.
- Mark as New
- Bookmark
- Subscribe
- Mute
- Subscribe to RSS Feed
- Permalink
- Report Inappropriate Content
Hi,
Move the Values below FQ in the pivot, it should work.
Best Regards,
MVV Satish.
- « Previous Replies
-
- 1
- 2
- Next Replies »