Unlock a world of possibilities! Login now and discover the exclusive benefits awaiting you.
- Qlik Community
- :
- All Forums
- :
- QlikView App Dev
- :
- Re: How to add multiple measures ( KPI's) in a lis...
- Subscribe to RSS Feed
- Mark Topic as New
- Mark Topic as Read
- Float this Topic for Current User
- Bookmark
- Subscribe
- Mute
- Printer Friendly Page
- Mark as New
- Bookmark
- Subscribe
- Mute
- Subscribe to RSS Feed
- Permalink
- Report Inappropriate Content
How to add multiple measures ( KPI's) in a list box for a single chart
Hi I have a bar chart and I need to provide user an option to select the measures or KPI's in a listbox so that whatever user selects , gets reflected in the chart. e.g. I have these 3 KPI's ( Sales , Profit , Order Count etc. ) and they need to be plotted against geography dimension. But they have to be one at a time, meaning whatever user selects from the list box that should be shown in the chart.
How is this possible in qlikview ?
Appreciate your help.
Thanks
Ajay
- Mark as New
- Bookmark
- Subscribe
- Mute
- Subscribe to RSS Feed
- Permalink
- Report Inappropriate Content
This blog post Customizable Straight Table explains how to do this as in create "a customizable straight table or ad-hoc report where the user can select the dimensions and measures that should appear in the chart"
- Mark as New
- Bookmark
- Subscribe
- Mute
- Subscribe to RSS Feed
- Permalink
- Report Inappropriate Content
Hi,
Can You provide a sample app! or Data.
-Hirish
- Mark as New
- Bookmark
- Subscribe
- Mute
- Subscribe to RSS Feed
- Permalink
- Report Inappropriate Content
Have you looked at the blog post Customizable Straight Table I suggested ?
It contains links to a sample app, data and step by step instructions.
- Mark as New
- Bookmark
- Subscribe
- Mute
- Subscribe to RSS Feed
- Permalink
- Report Inappropriate Content
If you don't need a complete customizable chart you could use expression-groups - the switch between the expressions won't be happen per listbox else per small circle-button within the chart (in header by table-charts and dragable by other chart-types).
- Marcus
- Mark as New
- Bookmark
- Subscribe
- Mute
- Subscribe to RSS Feed
- Permalink
- Report Inappropriate Content
Hi,
Check this as per the Bill suggestion,
Customizable straight table,
By creating Dimensions and Expressions like this,
Data:
LOAD Customer,
     [Sales Order ID],
     ShipDate as Date,
     Product,
     Sales,
     Quantity
FROM
[Sales Orders.xls]
(biff, embedded labels, table is [Sales Orders$]);


Dimensions:
LOAD * INLINE [Dimensions
  Call Customer
  Call Date
  Call Sales Order ID
  Call Product
];


MetricsORMeasures:
LOAD * INLINE [MetricsORMeasuresNO'S,MetricsORMeasures
1,Call Sales
2,Call Quantity
];
Front End:
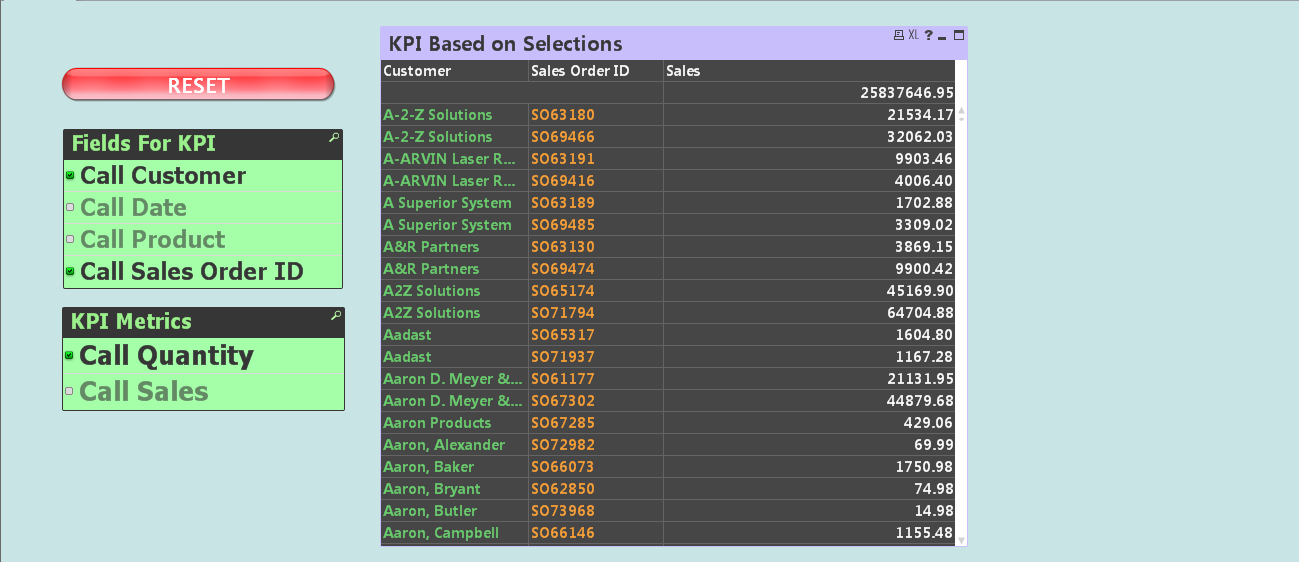
Using the Selection of dimensions and expression through list box , the straight table will display the Results.
Hope this helps,
PFA,
Hirish
- Mark as New
- Bookmark
- Subscribe
- Mute
- Subscribe to RSS Feed
- Permalink
- Report Inappropriate Content
Thanks Bill,
I will go through this blog and try to implement it.
Thanks
Ajay