Unlock a world of possibilities! Login now and discover the exclusive benefits awaiting you.
- Qlik Community
- :
- All Forums
- :
- QlikView App Dev
- :
- Re: How to add multiple variables to an expression...
- Subscribe to RSS Feed
- Mark Topic as New
- Mark Topic as Read
- Float this Topic for Current User
- Bookmark
- Subscribe
- Mute
- Printer Friendly Page
- Mark as New
- Bookmark
- Subscribe
- Mute
- Subscribe to RSS Feed
- Permalink
- Report Inappropriate Content
How to add multiple variables to an expression?
Hi,
I am trying to create a chart that shows the count of "Yes" and "No" from our data. I have two column legal validated (Yes/No) and Comp Validated (Yes/No). How can I get the count of No/No, Yes/No, No/Yes, all under the same count as 'No'? And then show a count of all the 'Yes/Yes"?
I was able to get a count of the Yes and No using this equation;
Dual(CompValidation&' - '&Count(DISTINCT([Topic),Count(DISTINCT(Topic)))
Thank you,
Nicholas
- « Previous Replies
-
- 1
- 2
- Next Replies »
- Mark as New
- Bookmark
- Subscribe
- Mute
- Subscribe to RSS Feed
- Permalink
- Report Inappropriate Content
No need of Recalculations all expressions are independent of each other.
I have done that in a pivot table and attached for your reference
- Mark as New
- Bookmark
- Subscribe
- Mute
- Subscribe to RSS Feed
- Permalink
- Report Inappropriate Content
HI,
Sorry for taking so long to respond. I understand what you did.  I am running into an error issue "all values below Limit." Any thoughts? My maximum number of slices is set to 15.
Thank you,
- Mark as New
- Bookmark
- Subscribe
- Mute
- Subscribe to RSS Feed
- Permalink
- Report Inappropriate Content
Hi Haagenfels,
Can you elaborate this problem a bit more. Is it related to the questions answered by me before.
Or is it different.
If different please elaborate it further.
- Mark as New
- Bookmark
- Subscribe
- Mute
- Subscribe to RSS Feed
- Permalink
- Report Inappropriate Content
Haagenfels,
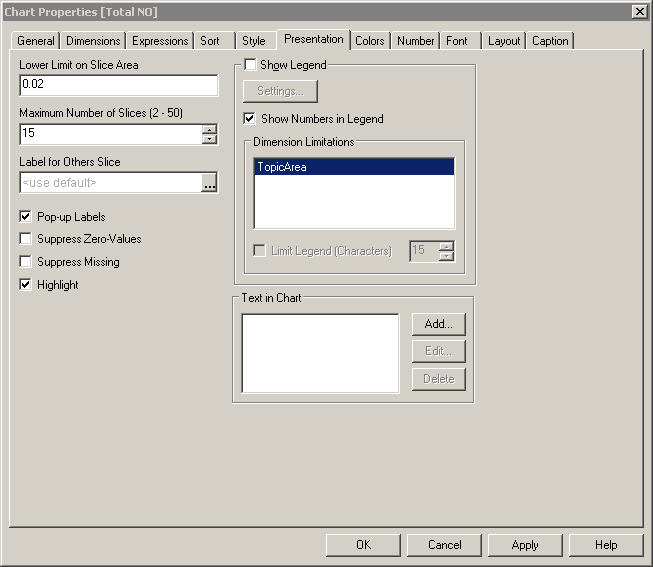
What I can speculate right now reading your requirement it seems you are facing problems with pie-charts.
I have attached a image on properties of Pie Charts
consisting of Dimension Limits Tab.
What I can suggest over here is that you need ti bit play around with the "limits" options
of the "Dimensions Limits" .
If you can send me a screen shot of the Dimension Limits of your chart i might be able to suggest you better.
Satyajeet
- Mark as New
- Bookmark
- Subscribe
- Mute
- Subscribe to RSS Feed
- Permalink
- Report Inappropriate Content
Hi,
Yes it is related to the question above. The pie chart i am trying to create come up with the error message mentioned above.
I am using qlikview 10. Do I have the same dimensions tab? Here is a screen shot of the limits i found with the pie chart.
- Mark as New
- Bookmark
- Subscribe
- Mute
- Subscribe to RSS Feed
- Permalink
- Report Inappropriate Content
Hi Haagenfels,
You need to reduce the lower limit to a very small fractional value
on " Lower Limit on Slice Area " option
and deselect the "Relative" option in Expressions tab too.
Please answer whether it worked or not.
- « Previous Replies
-
- 1
- 2
- Next Replies »