Unlock a world of possibilities! Login now and discover the exclusive benefits awaiting you.
- Qlik Community
- :
- All Forums
- :
- QlikView App Dev
- :
- Re: How to add planed YTD on a chart?
- Subscribe to RSS Feed
- Mark Topic as New
- Mark Topic as Read
- Float this Topic for Current User
- Bookmark
- Subscribe
- Mute
- Printer Friendly Page
- Mark as New
- Bookmark
- Subscribe
- Mute
- Subscribe to RSS Feed
- Permalink
- Report Inappropriate Content
How to add planed YTD on a chart?
Hi,
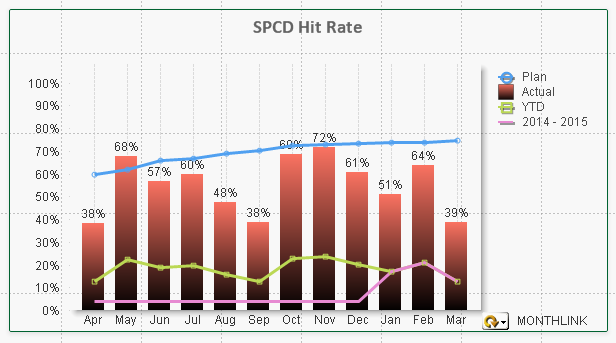
I have a chart as below where I want to show PLAN, Actual, YTD along with 2014 - 2015 (YTD). So I have used below query
Sum({<Year = {'2014', '2015' }>}[Actual SPCD hit rate_CUTTING]/12)
1. is the query is right?
2. If that so, I don't want to show 0% I just want to show the line only where there is a value how do I do that?
Eg: Line only on top of Jan, Feb and Mar
Accepted Solutions
- Mark as New
- Bookmark
- Subscribe
- Mute
- Subscribe to RSS Feed
- Permalink
- Report Inappropriate Content
answers
1. RangeAvg( above( avg([Actual GRN Hit Rate_STORES]),0,12) )
2. =avg({<Year={'$(vPriorYear)'} ,Month=,Day=,Date={'<=$(vYear)'}, MonthYear=>}[Actual GRN Hit Rate_STORES])
- Mark as New
- Bookmark
- Subscribe
- Mute
- Subscribe to RSS Feed
- Permalink
- Report Inappropriate Content
1. If I want to know YTD following query "avg([Actual SPCD hit rate_CUTTING]/12)" is right?
2. If I want to know YTD of 2015 following query "Sum({<Year = {'2014', '2015' }>}[Actual SPCD hit rate_CUTTING]/12)" is right?
3. guess you can see the pink line one the char there I don't won't the pink line to 0% I want only if there is an value, how do I do that?
- Mark as New
- Bookmark
- Subscribe
- Mute
- Subscribe to RSS Feed
- Permalink
- Report Inappropriate Content
answers
1. RangeAvg( above( avg([Actual GRN Hit Rate_STORES]),0,12) )
2. =avg({<Year={'$(vPriorYear)'} ,Month=,Day=,Date={'<=$(vYear)'}, MonthYear=>}[Actual GRN Hit Rate_STORES])