Unlock a world of possibilities! Login now and discover the exclusive benefits awaiting you.
- Qlik Community
- :
- All Forums
- :
- QlikView App Dev
- :
- Re: How to add relative proportion to line chart w...
- Subscribe to RSS Feed
- Mark Topic as New
- Mark Topic as Read
- Float this Topic for Current User
- Bookmark
- Subscribe
- Mute
- Printer Friendly Page
- Mark as New
- Bookmark
- Subscribe
- Mute
- Subscribe to RSS Feed
- Permalink
- Report Inappropriate Content
How to add relative proportion to line chart with absolute numbers
Hi,
I've encountered a problem enriching simple line charts with additional information. I wanted to add the relative proportion next to the line. I did some research and one possible solution is to add additional expressions with some if-logic in order to print only one value. However, the positioning is off. The value is being printed at the wrong line. If I add additional expressions, they are all printed at the same position, whereas when the relative proportion expressions exceed two, no values are shown anymore.
Variables:
// This formula expects the Source Agg as a parameter
SET eSumSource = (Sum({$<[Source Agg]={$1}>} Value));
// This formula calculates the relative proportion, but only for the latest x-value.
SET eSumSourceRel = If(YearWeek= Max(Total YearWeek), $(eSumSource($1)) / $(eSumSource('*')), '');
Explanations to the Chart:
- The x-axis shows the weekname.
- The top line is the sum of the lines below and expressed as an additional expression ($(eSumSource('*'))).
- The three lines below, each of them represent a specific source ($(eSumSource('Desktop'). Dark Blue = iOS, Green = Desktop, Red = Android.
- The numbers 19,4% and 27,0% are the results of the expression $(eSumSourceRel('Desktop')) and $(eSumSourceRel('iOS')), an unchecked line checkbox, but with a checked values on data points checkbox.
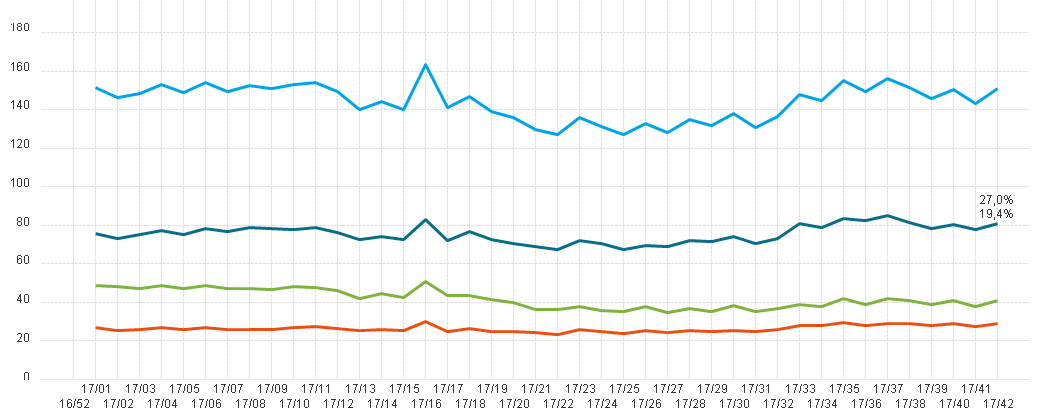
As you can see, the numbers are not correctly displayed even though the values are correct.
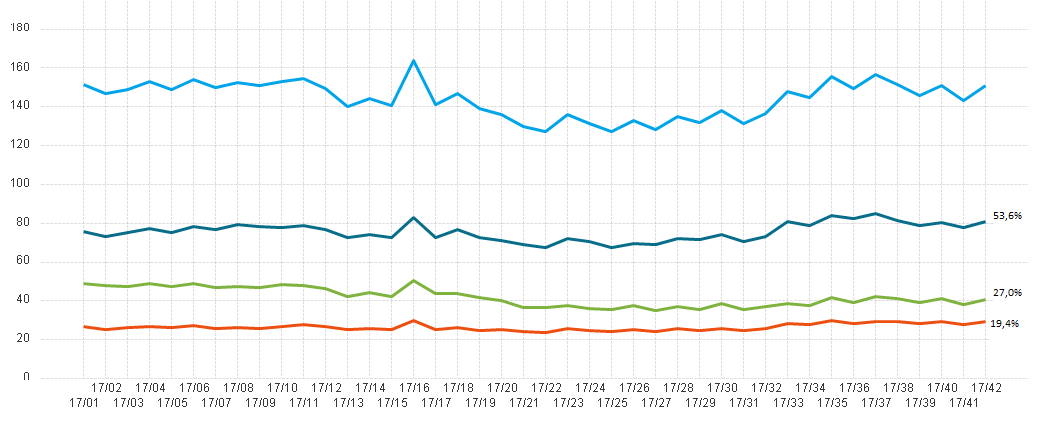
How it should look like:
Any help would be appreciated, thank you!
Best regards,
Flo
- Mark as New
- Bookmark
- Subscribe
- Mute
- Subscribe to RSS Feed
- Permalink
- Report Inappropriate Content
Hi, does anyone know how to solve this?