Unlock a world of possibilities! Login now and discover the exclusive benefits awaiting you.
- Qlik Community
- :
- All Forums
- :
- QlikView App Dev
- :
- Re: How to add text label in Qlik View???
- Subscribe to RSS Feed
- Mark Topic as New
- Mark Topic as Read
- Float this Topic for Current User
- Bookmark
- Subscribe
- Mute
- Printer Friendly Page
- Mark as New
- Bookmark
- Subscribe
- Mute
- Subscribe to RSS Feed
- Permalink
- Report Inappropriate Content
How to add text label in Qlik View???
Hi,
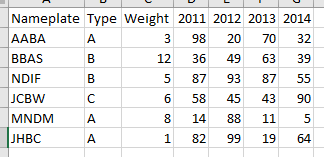
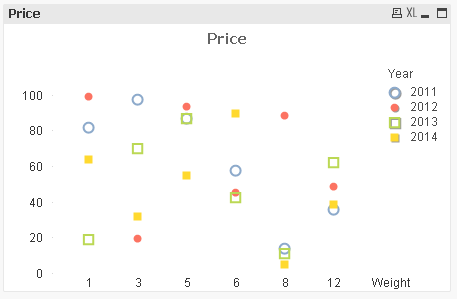
Anybody know how to show the nameplate near the data point???
I only know how to show the data label, but I don't know how to show the text label.
Below is a simple example.
- Mark as New
- Bookmark
- Subscribe
- Mute
- Subscribe to RSS Feed
- Permalink
- Report Inappropriate Content
Work around May be this?
Text & Chr(10) & Expression
- Mark as New
- Bookmark
- Subscribe
- Mute
- Subscribe to RSS Feed
- Permalink
- Report Inappropriate Content
Hi Cai,
Look in the chart's Presentation tab and check Labels on Datapoints.
cheers
Andrew
- Mark as New
- Bookmark
- Subscribe
- Mute
- Subscribe to RSS Feed
- Permalink
- Report Inappropriate Content
The presentation tab can only add some fixed text. I want to add the nameplate of every data point.
- Mark as New
- Bookmark
- Subscribe
- Mute
- Subscribe to RSS Feed
- Permalink
- Report Inappropriate Content
I tried, but it doesn't work. Even the data points cannot show. I am trying the dual function. Thank you for your answer!
- Mark as New
- Bookmark
- Subscribe
- Mute
- Subscribe to RSS Feed
- Permalink
- Report Inappropriate Content
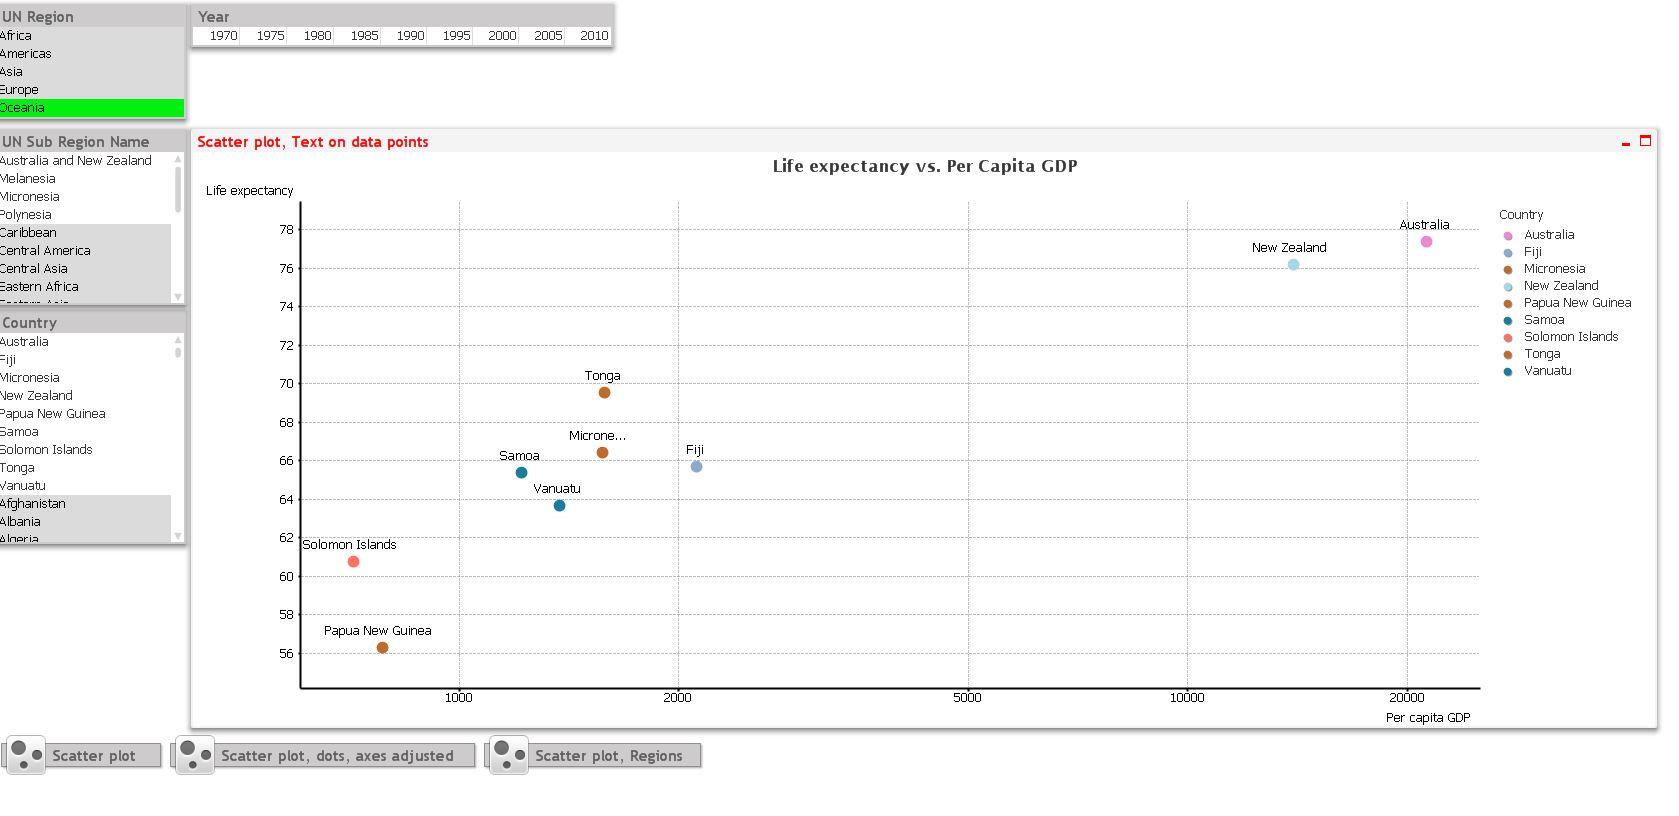
Hi Cai,
Find the attached example. And refer the doc more about scater and bubble chart here Creating a Scatter Chart
- Mark as New
- Bookmark
- Subscribe
- Mute
- Subscribe to RSS Feed
- Permalink
- Report Inappropriate Content
Thank you! I will try this.
- Mark as New
- Bookmark
- Subscribe
- Mute
- Subscribe to RSS Feed
- Permalink
- Report Inappropriate Content
Hi Cai,
Just write your expression (or call number format dimension)in expression tab in Combo chart
-->Expression tab-->write expression-->now select Display options -->Symbol-->Select circle/triangle/Dots...etc
else go for scatter chart it will show symbols instead of Data(symbols will show on behalf of Numbers)