Unlock a world of possibilities! Login now and discover the exclusive benefits awaiting you.
- Qlik Community
- :
- All Forums
- :
- QlikView App Dev
- :
- How to aggregate positive/negative values of expre...
- Subscribe to RSS Feed
- Mark Topic as New
- Mark Topic as Read
- Float this Topic for Current User
- Bookmark
- Subscribe
- Mute
- Printer Friendly Page
- Mark as New
- Bookmark
- Subscribe
- Mute
- Subscribe to RSS Feed
- Permalink
- Report Inappropriate Content
How to aggregate positive/negative values of expression
Let's say I load the following two tables :
| Item | Amount 1 | Amount 2 |
|---|---|---|
| A | 100 | 0 |
B | 0 | 40 |
| C | 50 | 40 |
| D | 150 | 100 |
| Item | Amount 1 | Amount 2 |
|---|---|---|
| A | 100 | 20 |
B | 10 | 20 |
| E | 20 | 30 |
| F | 100 | 75 |
I want to do the following :
1) Display a table with the difference D between Amount 2 and Amount1 (D = Amount 2 - Amount 1)
2) Display a table with only the lines where D >0, where D <0
3) Make and aggregation like : how many lines where D is negative and D/Amount 1 is between 0 and 10%, 10% and 20%, etc.
So
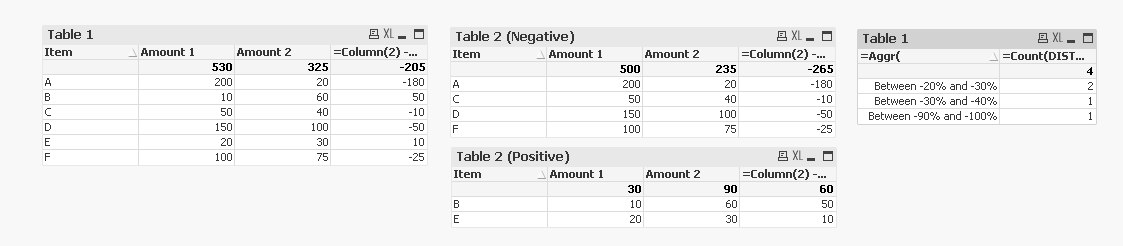
1) Display a table with the difference D betwenn Amount 2 and Amount1 (D = Amount 2 - Amount 1)
->it is easy, I use a table with Item as dimension, and 3 expressions (sum(Amount 1), sum(Amount 2), sum(Amount2)-Sum(Amount 1); this gives Something like
| Item | Amount 1 | Amount 2 | D |
|---|---|---|---|
| A | 200 | 20 | -180 |
| B | 10 | 60 | 50 |
| C | 50 | 40 | -10 |
| D | 150 | 100 | -50 |
| E | 20 | 30 | 10 |
| F | 100 | 75 | -25 |
| TOTAL | 530 | 325 | -205 |
2) Display a table with only the lines where D >0 or where D <0
How do I obtain this
| Item | Amount 1 | Amount 2 | D |
|---|---|---|---|
| B | 10 | 60 | 50 |
| E | 20 | 30 | 10 |
| TOTAL | 30 | 90 | 60 |
and this
| Item | Amount 1 | Amount 2 | D |
|---|---|---|---|
| A | 200 | 20 | -180 |
| C | 50 | 40 | -10 |
| D | 150 | 100 | -50 |
| F | 100 | 75 | -25 |
| TOTAL | 500 | 235 | -265 |
3) Make and aggregation like : nbr of lines where D is negative and D/Amount 1 is between 0 and 10%, 10% and 20%, etc.
How do I obtain this?
| Decrease range | # of items |
|---|---|
| Between 0% and -10% | 0 |
| Between -10% and -20% | 0 |
| Between -20% and -30% | 2 (*) |
| Between -30% and -40% | 1(**) |
| Between -40% and -50% | 0 |
| Between -50% and -60% | 0 |
| Between -60% and -70% | 0 |
| Between -70% and -80% | 0 |
| Between -80% and -90% | 0 |
| Between -90% and -100% | 1 (***) |
(*) is C and F
(**) id D
(***) is A
Olivier
- Mark as New
- Bookmark
- Subscribe
- Mute
- Subscribe to RSS Feed
- Permalink
- Report Inappropriate Content
Check the attached
- Mark as New
- Bookmark
- Subscribe
- Mute
- Subscribe to RSS Feed
- Permalink
- Report Inappropriate Content
Hi Sunny,
I am so impressed! Exactly what I was looking for...
Now if I may ask; could you explain to me a bit what is exactly going in the following lines :
=Sum({<Item = {"=Sum([Amount 2]) - Sum([Amount 1]) < 0"}>}[Amount 1])
it looks like a set analysis statement, but I don't get the "Item = Something being < 0"
Also I really don't get what's going on in the aggr dimension
Aggr(
If(Sum([Amount 2]) - Sum([Amount 1]) < 0,
If((Sum([Amount 2]) - Sum([Amount 1]))/Sum([Amount 1]) > -0.1, Dual('Between 0% and -10%', 1),
If((Sum([Amount 2]) - Sum([Amount 1]))/Sum([Amount 1]) > -0.2, Dual('Between -10% and -20%', 2),
If((Sum([Amount 2]) - Sum([Amount 1]))/Sum([Amount 1]) > -0.3, Dual('Between -20% and -30%', 3),
If((Sum([Amount 2]) - Sum([Amount 1]))/Sum([Amount 1]) > -0.4, Dual('Between -30% and -40%', 4),
If((Sum([Amount 2]) - Sum([Amount 1]))/Sum([Amount 1]) > -0.5, Dual('Between -40% and -50%', 5),
If((Sum([Amount 2]) - Sum([Amount 1]))/Sum([Amount 1]) > -0.6, Dual('Between -50% and -60%', 6),
If((Sum([Amount 2]) - Sum([Amount 1]))/Sum([Amount 1]) > -0.7, Dual('Between -60% and -70%', 7),
If((Sum([Amount 2]) - Sum([Amount 1]))/Sum([Amount 1]) > -0.8, Dual('Between -70% and -80%', 8),
If((Sum([Amount 2]) - Sum([Amount 1]))/Sum([Amount 1]) > -0.9, Dual('Between -80% and -90%', 9),
If((Sum([Amount 2]) - Sum([Amount 1]))/Sum([Amount 1]) > -1, Dual('Between -90% and -100%', 10)))))))))))), Item)
Thanks
Olivier
- Mark as New
- Bookmark
- Subscribe
- Mute
- Subscribe to RSS Feed
- Permalink
- Report Inappropriate Content
To answer your first question... look here for search string
It basically evaluates the condition with a Boolean result against the field name. If the value is true, the row is included in the expression, else it is excluded.
For the second thing, check here
- Mark as New
- Bookmark
- Subscribe
- Mute
- Subscribe to RSS Feed
- Permalink
- Report Inappropriate Content
Thank you very much for this very helpful example of the Dual aggregation of Positive/Negative values!