Unlock a world of possibilities! Login now and discover the exclusive benefits awaiting you.
- Qlik Community
- :
- All Forums
- :
- QlikView App Dev
- :
- How to calculate running sum and create buckets
- Subscribe to RSS Feed
- Mark Topic as New
- Mark Topic as Read
- Float this Topic for Current User
- Bookmark
- Subscribe
- Mute
- Printer Friendly Page
- Mark as New
- Bookmark
- Subscribe
- Mute
- Subscribe to RSS Feed
- Permalink
- Report Inappropriate Content
How to calculate running sum and create buckets
Hi,
I want to calculate running sum for accounts and also create buckets using running sum % values as below. Please help me to correct formulas
1. Running sum of sales: i have used below expression to calculate it.
RangeSum(Above(sum(SLS_AMT),0,RowNo()))
2. Running sum % :
RangeSum(Above(sum(SLS_AMT),0,RowNo()))/sum(TOTAL SLS_AMT)
3. Segments :
if(Running sum % <=0.2, 'Top 20%',
if(Running sum % >0.2 and Running sum % <=0.4 , 'Middle 20%','Bottom 40%'))
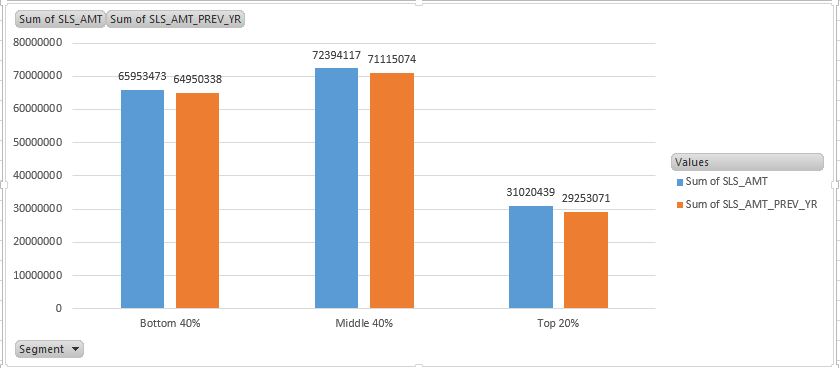
Using the above buckets i want to create a bar chart as below. Please help me to create the below bar chart.
- Mark as New
- Bookmark
- Subscribe
- Mute
- Subscribe to RSS Feed
- Permalink
- Report Inappropriate Content
Let me explain you the story.
Actually we are creating three segments(T20,M40,B40) using 2016 Accounts and 2016 running sum% of Sales data(Sheet - 2016 Sales). Once the segments are created(in Sheet 3) we are doing vlookup with 2017 accounts(Sheet - Data) to check which 2017th Account falls under which segment. When accounts doesn't matches as u said for Acct_NO 56320, we get N/A's. These N/A's are replaced with Bottom 40%.
2016 Sales data is only used to create segments. Please let me know if you need more clarification.
- Mark as New
- Bookmark
- Subscribe
- Mute
- Subscribe to RSS Feed
- Permalink
- Report Inappropriate Content
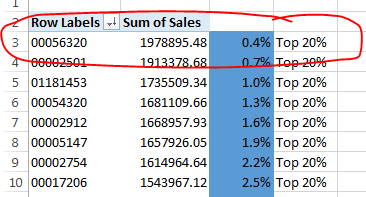
But in your example 56320 is not 'Bottom 40%', it is actually 'Top 20%' 
- Mark as New
- Bookmark
- Subscribe
- Mute
- Subscribe to RSS Feed
- Permalink
- Report Inappropriate Content
Sorry my bad
Actually we are doing vlookup from 2017 accounts(Sheet - Data) to 2016 Accounts(Sheet 3). Hence the Acct_No 56320 will be ignored. It is like left join between 2017 accounts and 2016 Accounts. Hence it will take all the records from 2017 accounts and only matching records from 2016 data and therefore the Acct_No 56320 will be ignored.
I mentioned about N/A's which will be replaced with bottom 40%. However, it will be done only for the non matching records of 2017 accounts as 2016 non matching accounts will be ignored in vlookup.
- Mark as New
- Bookmark
- Subscribe
- Mute
- Subscribe to RSS Feed
- Permalink
- Report Inappropriate Content
Few things
1) Are you absolutely 100% sure that the numbers that you see in your chart are the numbers you should get from qvw?
2) If number 1 is true, I would need to see the whole process you did to come up with the numbers in Excel.
- Mark as New
- Bookmark
- Subscribe
- Mute
- Subscribe to RSS Feed
- Permalink
- Report Inappropriate Content
Yes Sunny.
I have attached excel file with bar chart. You can use it for reference. Please let me know if you need more clarification.
Sorry i am bugging you a lot
- Mark as New
- Bookmark
- Subscribe
- Mute
- Subscribe to RSS Feed
- Permalink
- Report Inappropriate Content
I think my problem is that I am not sure how you are flagging Top20%, Middle 40% and Bottom 40%... you have hard-coded these values in your Excel and I am not sure how this is done. Unless I know the logic (or see the logic), I will not be able to replicate what you have in the Excel
- Mark as New
- Bookmark
- Subscribe
- Mute
- Subscribe to RSS Feed
- Permalink
- Report Inappropriate Content
Hi Sunny,
Please find the excel file with calculations for Segments in original post. Please refer sheet 3.
- Mark as New
- Bookmark
- Subscribe
- Mute
- Subscribe to RSS Feed
- Permalink
- Report Inappropriate Content
Hahahahaha where is ACCT_NO 56320 on the data tab? This is what we are loading and I can't find 56320 on this tab....
- Mark as New
- Bookmark
- Subscribe
- Mute
- Subscribe to RSS Feed
- Permalink
- Report Inappropriate Content
We cannot find that account number because it is present in sheet3. We are doing vlookup from Data tab to sheet3 ( i,e. Data leftjoin Sheet3) to get Segments column into Data tab, hence we will get all the account numbers from data tab and only matching records from sheet3.
Since 56320 is part of sheet3(right table) and it is not matching with any of the accounts in Data,hence the Acct_No 56320 will be ignored.
I mentioned about N/A's which will be replaced with bottom 40%. However, it will be done only for the non matching records of 2017 accounts as 2016 non matching accounts will be ignored in vlookup.
- Mark as New
- Bookmark
- Subscribe
- Mute
- Subscribe to RSS Feed
- Permalink
- Report Inappropriate Content
It makes sense.... so these flags are based on 2016 sales numbers? And 2016 sales numbers are loaded from a file like 2016 sales tab?