Unlock a world of possibilities! Login now and discover the exclusive benefits awaiting you.
- Qlik Community
- :
- All Forums
- :
- QlikView App Dev
- :
- How to calculate the Growth
- Subscribe to RSS Feed
- Mark Topic as New
- Mark Topic as Read
- Float this Topic for Current User
- Bookmark
- Subscribe
- Mute
- Printer Friendly Page
- Mark as New
- Bookmark
- Subscribe
- Mute
- Subscribe to RSS Feed
- Permalink
- Report Inappropriate Content
How to calculate the Growth
Dear All,
I here by attached my sample data, which i want to calculate the growth. can any one help me in this regard.
Rgds,
Priyantha.
- Tags:
- new_to_qlikview
- « Previous Replies
-
- 1
- 2
- Next Replies »
- Mark as New
- Bookmark
- Subscribe
- Mute
- Subscribe to RSS Feed
- Permalink
- Report Inappropriate Content
Can you post expected output
- Mark as New
- Bookmark
- Subscribe
- Mute
- Subscribe to RSS Feed
- Permalink
- Report Inappropriate Content
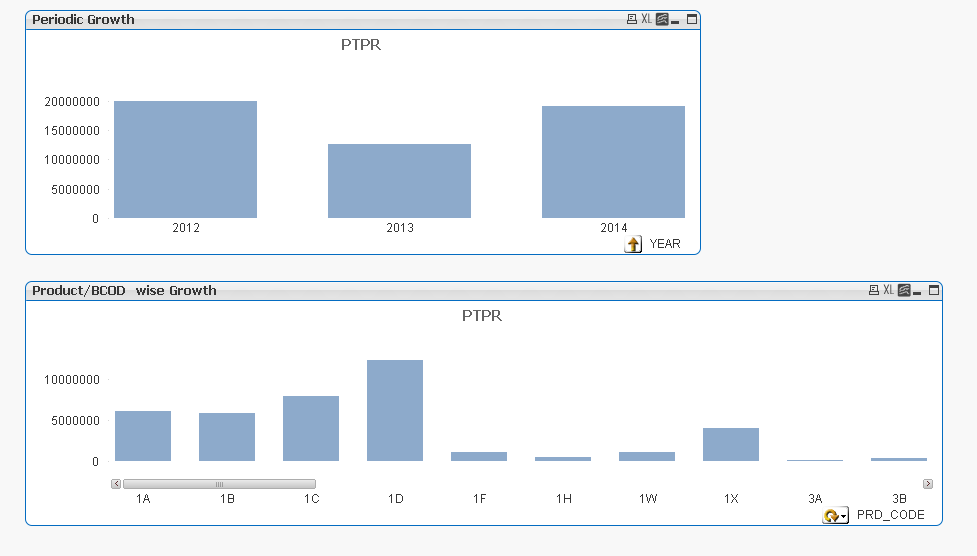
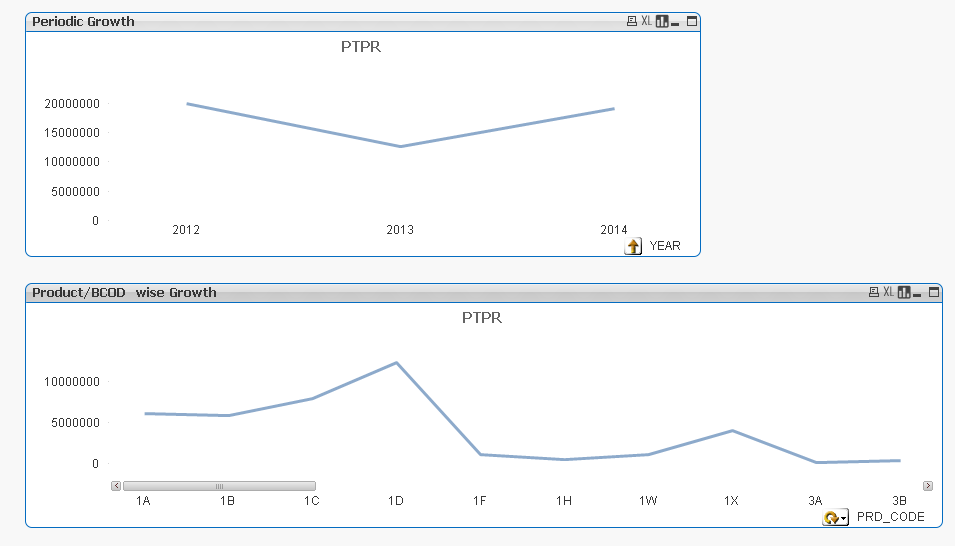
growth can be represented by Line chart or bar chart as required by user on the basis of different Dimension,
if you dont have clear requirement then show them all possible representation by grouping dimension in drill down or cyclic group and show both chart line and bar with the help of fast change option as in Image below or find a sample application in attachment

- Mark as New
- Bookmark
- Subscribe
- Mute
- Subscribe to RSS Feed
- Permalink
- Report Inappropriate Content
You have post your desired output or the formula for calculating the growth.
- Mark as New
- Bookmark
- Subscribe
- Mute
- Subscribe to RSS Feed
- Permalink
- Report Inappropriate Content
Dear Anbu,
My table like this,
| PRD_CODE | BCOD | MONTH | YEAR | PTPR | GROWTH |
| 1A | B100 | APR | 2012 | 178740 | |
| 1B | B100 | APR | 2012 | 214184 | |
| 1C | B100 | APR | 2012 | 205433 |
| 1A | BB00 | APR | 2013 | 48813 |
| 1B | BB00 | APR | 2013 | 76630 |
| 1C | BB00 | APR | 2013 | -36508 |
| 1A | BB00 | APR | 2014 | 128540 |
| 1B | BB00 | APR | 2014 | 4402 |
| 1C | BB00 | APR | 2014 | 51992 |
I want to calculate the Growth of 2013 against the results of 2012. and 2014 growth against the year 2013.
What is the formula i should applied.
Simple example for 2014 1A product, = (128540-48813)/48813
Please help,
Rgds,
Priyantha.
- Mark as New
- Bookmark
- Subscribe
- Mute
- Subscribe to RSS Feed
- Permalink
- Report Inappropriate Content
Temp:
Load PRD_CODE,BCOD,MONTH,YEAR,PTPR From Excel.xlsx
Final:
NoConcatenate
Load *,If(PRD_CODE=Previous(PRD_CODE) And BCOD = Previous(BCOD) And MONTH = Previous(MONTH) And
Year = Previous(Year)+1, (PTPR - Previous(PTPR))/Previous(PTPR)) As Growth Resident Temp Order by PRD_CODE,BCOD,MONTH,YEAR;
Drop table Temp;
- Mark as New
- Bookmark
- Subscribe
- Mute
- Subscribe to RSS Feed
- Permalink
- Report Inappropriate Content
Hi Priyantha,
You can achieve the desired output by the following steps:
1) create a grid chart.
2) Add BCOD,PROD_CODE as dimension
3) In expressions,use the following set analysis:
((sum({<Year ={"$(=max(Year))"}>}PTPR) - sum({<Year ={"$(=max(Year)-1)"}>}PTPR))/sum({<Year ={"$(=max(Year)-1)"}>}PTPR) )
and label it as growth
Output is for growth of 2014 against 2013:
PROD_CODE Growth
1A 1.633
1B -0.94
1C -1.14
The above output suffices the formula for 2014 1A product :(128540-48813)/48813 = 1.633
By default, the values displayed are for current year.On selection of any other year,the corresponding values would change according to the selected year and its previous one.
Hope this information is useful.
regards,
Snehal Nabar
- Mark as New
- Bookmark
- Subscribe
- Mute
- Subscribe to RSS Feed
- Permalink
- Report Inappropriate Content
Dear Snehal,
Thanks a lot for the valuable reply,
In this case we want to consider the 'MONTH' also not only the year.
My attempt to calculate the growth against the previous year same month and same product.
Please help me to find the way...
Rgds,
Priyantha
- Mark as New
- Bookmark
- Subscribe
- Mute
- Subscribe to RSS Feed
- Permalink
- Report Inappropriate Content
Dear Anbu,
Thanks for the early reply,
Your scrip change was tried and failed. Please give some solution with expression part in the table.
Rgds,
Priyantha.
- Mark as New
- Bookmark
- Subscribe
- Mute
- Subscribe to RSS Feed
- Permalink
- Report Inappropriate Content
Hi,
Try like this,Please concentrate at the brackets
=if(PROD_CODE='1A' or if(PROD_CODE='1B' or if(PROD_CODE='1C' , (sum({<year={"$(=max(year))"}>}PTPR)-sum({<year={"$(=max(year)-1)"}>}PTPR)) /
sum({<year={"$(=max(year)-1)"}>}PTPR)))))
Regards
Krishna
- « Previous Replies
-
- 1
- 2
- Next Replies »