Unlock a world of possibilities! Login now and discover the exclusive benefits awaiting you.
- Qlik Community
- :
- All Forums
- :
- QlikView App Dev
- :
- Re: How to calculate the expression for every poss...
- Subscribe to RSS Feed
- Mark Topic as New
- Mark Topic as Read
- Float this Topic for Current User
- Bookmark
- Subscribe
- Mute
- Printer Friendly Page
- Mark as New
- Bookmark
- Subscribe
- Mute
- Subscribe to RSS Feed
- Permalink
- Report Inappropriate Content
How to calculate the expression for every possible value of the dimension in a chart?
Hi all,
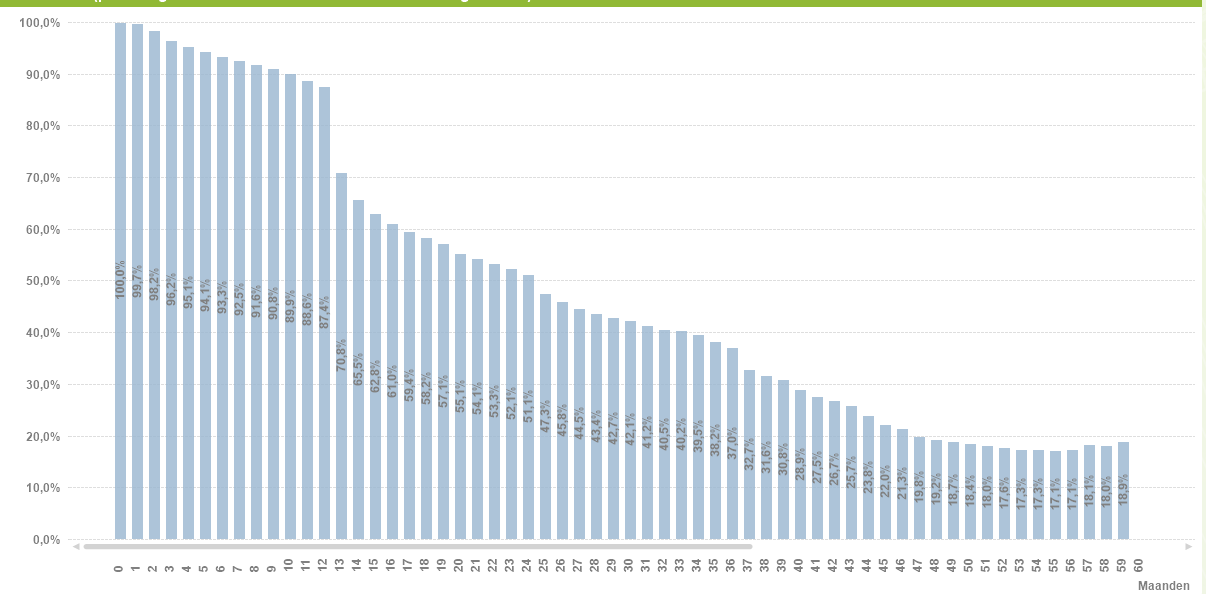
I'm trying to create a chart where the expression is calculated separately for every value of the chart's dimension.
Dimension: DimMonths (ranging from 1 to 100, generated with AutoGenerate)
Expression: Count( {< ActiveMonths = {">=$(=DimMonths)"} >} Customer) / Count( {< PotentialMonths = {">=$(=DimMonths)"} >} Customer)
End result should look like this:

The above expression obviously doesn't work, because Qlikview does not calculate the expression for all possible values of DimMonths. I made it work with an nested IF-statement, but with 100+ distinct values this is obviously terrible for performance, readability and maintenance:
IF(DimMonths = 0,COUNT( {< ActiveMonths = {">=0"} >} Customer) / COUNT( {< PotentialMonths = {">=0"} >} Customer),
IF(DimMonths = 1,COUNT( {< ActiveMonths = {">=1"} >} Customer) / COUNT( {< PotentialMonths = {">=1"} >} Customer),
IF(DimMonths = 2,COUNT( {< ActiveMonths = {">=2"} >} Customer) / COUNT( {< PotentialMonths = {">=2"} >} Customer),
Etc...
Etc...
Does anyone know a better solution?
-----------------------------------------------------------------
Here is some (simplified) sample data:
DimMonths:
LOAD RecNo() AS DimMonths
AUTOGENERATE(5);
| Customer | ContractStart | ContractEnd | PotentialMonths (= Nov16– ContractStart) | ActiveMonths (= ISNULL(ContractEnd,Nov16) – ContractStart) |
|---|---|---|---|---|
| A | June16 | - | 5 | 5 |
| B | June16 | Sep16 | 5 | 3 |
| C | Juli16 | Okt16 | 4 | 3 |
| D | Juli16 | - | 4 | 4 |
| E | Aug16 | Sep16 | 3 | 1 |
| F | Aug16 | Okt16 | 3 | 2 |
| G | Sep16 | - | 2 | 2 |
| H | Sep16 | - | 2 | 2 |
| I | Okt16 | - | 1 | 1 |
| J | Okt16 | Okt16 | 1 | 0 |
I'm looking for an expression that gives me this result. I cannot make the calculations in the load script, because the graph needs to be responsive to other dimensions.
| Active | Potential | Rest | |
|---|---|---|---|
| Minimal 1 month active | 9 | 10 | 90% |
| Minimal 2 month active | 7 | 8 | 88% |
| Minimal 3 month active | 4 | 6 | 66% |
| Minimal 4 month active | 2 | 4 | 50% |
| Minimal 5 month active | 1 | 2 | 50% |
- « Previous Replies
-
- 1
- 2
- Next Replies »
- Mark as New
- Bookmark
- Subscribe
- Mute
- Subscribe to RSS Feed
- Permalink
- Report Inappropriate Content
John -
This looks great, but would this work if I select a particular month from my master calendar (it's not built in there, but assuming it was there). If I select lets say Aug 16, would the numbers update accordingly?
- Mark as New
- Bookmark
- Subscribe
- Mute
- Subscribe to RSS Feed
- Permalink
- Report Inappropriate Content
The current data set wouldn't work directly with a single master calendar, as the only dates are ContractStart and ContractEnd. So actual months would have to be some sort of additional table, like a table with every month between ContractStart and ContractEnd. If you then selected one of the months in that table, it would limit which customers are being included, and so change your results. Whether that's what we want or not would depend on the requirements.
And certainly selections made on the data we DO have changes the results. If I pick a Customer, then I'll only see data for that customer, and the % will probably be meaningless.
So maybe it would be better to use {1} as our base set instead of {$}, and = rather than *=, but I'm unsure, since I don't know the actual requirements.
- Mark as New
- Bookmark
- Subscribe
- Mute
- Subscribe to RSS Feed
- Permalink
- Report Inappropriate Content
@John and @Jakub: Thanks! This method looks very promising. I will apply it to my data set and will get back to you with results. PS: the requirements do not specify a master calendar, but i do have other dimensions (sales channels, contract types, etc) that it should respons to.
- Mark as New
- Bookmark
- Subscribe
- Mute
- Subscribe to RSS Feed
- Permalink
- Report Inappropriate Content
Works like a charm! Very easy and elegant solution and performance is excellent. Thanks for your help guys!
- « Previous Replies
-
- 1
- 2
- Next Replies »