Unlock a world of possibilities! Login now and discover the exclusive benefits awaiting you.
- Qlik Community
- :
- All Forums
- :
- QlikView App Dev
- :
- Re: How to calculate the values between particular...
- Subscribe to RSS Feed
- Mark Topic as New
- Mark Topic as Read
- Float this Topic for Current User
- Bookmark
- Subscribe
- Mute
- Printer Friendly Page
- Mark as New
- Bookmark
- Subscribe
- Mute
- Subscribe to RSS Feed
- Permalink
- Report Inappropriate Content
How to calculate the values between particular range
Hello Everyone
I have below issue
I need to calculate the range for sum(Room)
i have date, month and rooms
for example i have 20 rooms for date1,
12 rooms for date2
18 rooms for date3
45 rooms for date4
32 rooms for date5 in a month
date1, date2 and date3 sum(rooms) fall in '10-20' range, date4 and date5 fall in '20-50' range.
so i need to create the chart with two bars, month is my dimension and rooms is measure, here i need to get two bars one for 10-20 having sum(rooms) as 50, second one for 20-50 having sum(rooms) 77
Please help me in that, please check the attached excel for the sample data
- Tags:
- qlikview
Accepted Solutions
- Mark as New
- Bookmark
- Subscribe
- Mute
- Subscribe to RSS Feed
- Permalink
- Report Inappropriate Content
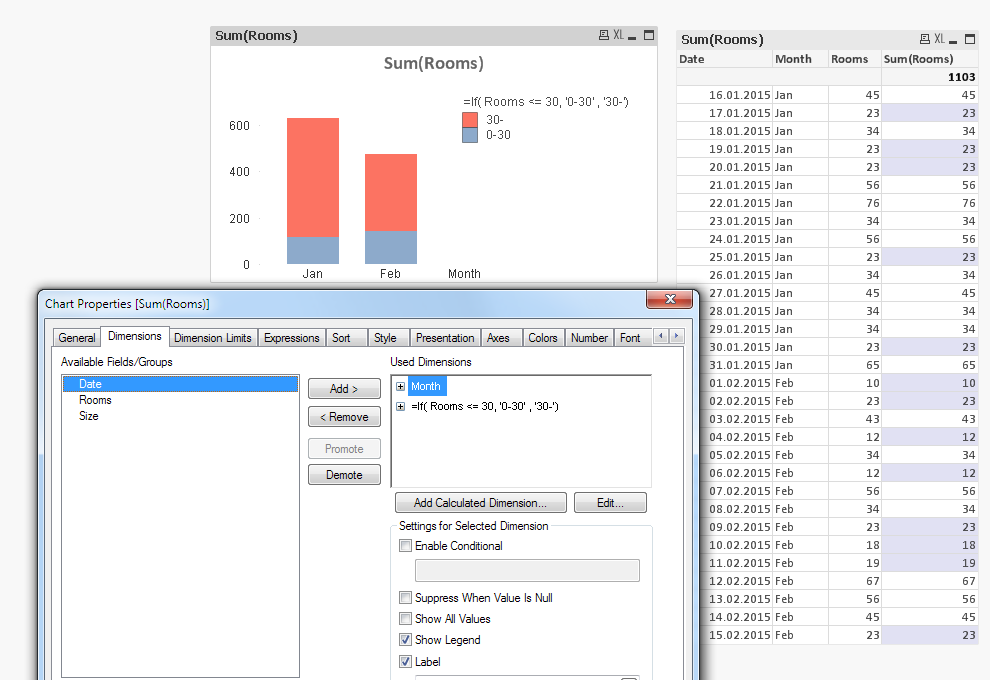
If you can't do it in the script you can still use a "Calculated Dimension" as shown below:
- Mark as New
- Bookmark
- Subscribe
- Mute
- Subscribe to RSS Feed
- Permalink
- Report Inappropriate Content
Use second calculated dimension:
class(aggr(sum(Rooms),Date),20)
- Mark as New
- Bookmark
- Subscribe
- Mute
- Subscribe to RSS Feed
- Permalink
- Report Inappropriate Content
Hello,
I hope this approaches what you need.
Regards,
Johan
- Mark as New
- Bookmark
- Subscribe
- Mute
- Subscribe to RSS Feed
- Permalink
- Report Inappropriate Content
Hello Alexander,
Thanks for the quick response,
I need to have only one dimension, that too only moth.
Please check the attached image how i need to represent the chart
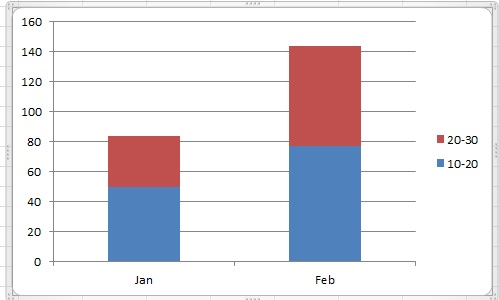
Thanks
- Mark as New
- Bookmark
- Subscribe
- Mute
- Subscribe to RSS Feed
- Permalink
- Report Inappropriate Content
It is still two dimensions there, you just need check "Stacked" in subtype of chart on page "Style" in object properties.
- Mark as New
- Bookmark
- Subscribe
- Mute
- Subscribe to RSS Feed
- Permalink
- Report Inappropriate Content
Thank you so much Johan for the response.
Can you please see the reply what i have given to the Alexander, I need the chart like that.
I can not do any calculations at script since i am having many calculations involved in to that.
Thanks
- Mark as New
- Bookmark
- Subscribe
- Mute
- Subscribe to RSS Feed
- Permalink
- Report Inappropriate Content
If you can't do it in the script you can still use a "Calculated Dimension" as shown below:
- Mark as New
- Bookmark
- Subscribe
- Mute
- Subscribe to RSS Feed
- Permalink
- Report Inappropriate Content
Thank you so much Petter
Wonderful solution for me