Unlock a world of possibilities! Login now and discover the exclusive benefits awaiting you.
- Qlik Community
- :
- All Forums
- :
- QlikView App Dev
- :
- How to calculate value for maximum date/period for...
- Subscribe to RSS Feed
- Mark Topic as New
- Mark Topic as Read
- Float this Topic for Current User
- Bookmark
- Subscribe
- Mute
- Printer Friendly Page
- Mark as New
- Bookmark
- Subscribe
- Mute
- Subscribe to RSS Feed
- Permalink
- Report Inappropriate Content
How to calculate value for maximum date/period for balance sheet values
I've got financial data that includes ending period balances that are semi-additive. That is, it is correct to sum the closing balances across a number of individual accounts that comprise, say, "Current Assets"; however, it would not be correct to sum the balances across the time dimension because the values represent snapshots at the end of each period.
I need a formula to chart the account balances over various levels of time granularity--e.g. by month or period, by quarter, and by year. The chart works perfectly at the most granular level of individual accounting periods (for the field [Year-Period]). However, whenever the dimension is collapsed to a quarter, or a fiscal year, the aggregation I've built fails because it sums the balance amounts for different periods, which is incorrect. I've hit on the idea of grabbing the maximum value of the [Year-Period] field as part of a set analysis shown in the formulae below, but this isn't working.
I created an example QVD (attached) with data similar in structure to the data I'm working with. The table below is the data set.
Example Data
| Date | Year-Period | YEAR | MONTH | ACCOUNT | # BALANCE |
| 1/31/10 | 2010-01 | 2010 | 1 | A | 100 |
| 2/28/10 | 2010-02 | 2010 | 2 | A | 200 |
| 3/31/10 | 2010-03 | 2010 | 3 | A | 300 |
| 4/30/10 | 2010-04 | 2010 | 4 | A | 400 |
| 5/31/10 | 2010-05 | 2010 | 5 | A | 500 |
| 6/30/10 | 2010-06 | 2010 | 6 | A | 600 |
| 7/31/10 | 2010-07 | 2010 | 7 | A | 700 |
| 8/31/10 | 2010-08 | 2010 | 8 | A | 800 |
| 9/30/10 | 2010-09 | 2010 | 9 | A | 900 |
| 10/31/10 | 2010-10 | 2010 | 10 | A | 1000 |
| 11/30/10 | 2010-11 | 2010 | 11 | A | 1100 |
| 12/31/10 | 2010-12 | 2010 | 12 | A | 99 |
| 12/31/10 | 2010-12 | 2010 | 12 | A | 1200 |
| 1/31/11 | 2011-01 | 2011 | 1 | A | 110 |
| 2/28/11 | 2011-02 | 2011 | 2 | A | 120 |
| 3/31/11 | 2011-03 | 2011 | 3 | A | 130 |
| 4/30/11 | 2011-04 | 2011 | 4 | A | 140 |
| 1/31/10 | 2010-01 | 2010 | 1 | B | 101 |
| 2/28/10 | 2010-02 | 2010 | 2 | B | 202 |
| 3/31/10 | 2010-03 | 2010 | 3 | B | 303 |
| 4/30/10 | 2010-04 | 2010 | 4 | B | 404 |
| 5/31/10 | 2010-05 | 2010 | 5 | B | 505 |
| 6/30/10 | 2010-06 | 2010 | 6 | B | 606 |
| 7/31/10 | 2010-07 | 2010 | 7 | B | 707 |
| 8/31/10 | 2010-08 | 2010 | 8 | B | 808 |
| 9/30/10 | 2010-09 | 2010 | 9 | B | 909 |
| 10/31/10 | 2010-10 | 2010 | 10 | B | 1010 |
| 11/30/10 | 2010-11 | 2010 | 11 | B | 1111 |
| 12/31/10 | 2010-12 | 2010 | 12 | B | 1212 |
[Year-Period] as the Dimension
When the aggregations are performed to sum by account, by period, the following expression works correctly:
=SUM(
{$< ACCOUNT = {'A'} >}
[# BALANCE]
)
For a chart where [Year-Period] is set as the dimension, the formula returns the value 1299, as expected, for period 2010-12. Again, [Year-Period] is the most granular dimension level.
[Year] as the Dimension
However, when the dimension is collapsed to years, the formula returns the value 7899, which is the sum of all of the values during the year. I attempted to use AGGR to calculate, but this doesn't work (it works for [Year-Period] as the dimension, same as the formula above):
=AGGR(
SUM(
{$< ACCOUNT = {'A'} >}
[# BALANCE]),
[Year-Period]
)
Within the chart, for dimension using [YEAR], the formula `MAX([Year-Period])` correctly returns "2010-12" for 2010 and "2011-04" for 2011. However, when this formula is used with a set analysis, it calculates the maximum value of [Year-Period] for the entire field, not for the dimension row.
=sum(
AGGR(
SUM(
{$< ACCOUNT = {'A'},
[Year-Period] = {'$(=Max([Year-Period]))'}
>}
[# BALANCE]),
[Year-Period]
)
)
The formula above calculates a balance of 140 for 2011 (which is correct). However, it returns a 0 for 2010, when it should return 1299.
The Question
What is the best way to return a calculation that always references the maximum value of the [Year-Period], regardless of whether the dimension is set to years, quarters, or periods? I need the formula to look within the set of values that correspond to each dimension row, find the maximum value (i.e. 2010-12 would be the maximum value for the year 2010, while 2010-06 would be the maximum value for Q2-2010), and sum the balances that match that period for a given set of accounts.
Appreciate any help!
Accepted Solutions
- Mark as New
- Bookmark
- Subscribe
- Mute
- Subscribe to RSS Feed
- Permalink
- Report Inappropriate Content
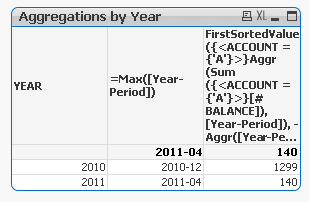
Try FirstSortedValue function here:
FirstSortedValue({<ACCOUNT = {'A'}>}Aggr(Sum({<ACCOUNT = {'A'}>}[# BALANCE]), [Year-Period]), -Aggr([Year-Period], [Year-Period]))
- Mark as New
- Bookmark
- Subscribe
- Mute
- Subscribe to RSS Feed
- Permalink
- Report Inappropriate Content
Try FirstSortedValue function here:
FirstSortedValue({<ACCOUNT = {'A'}>}Aggr(Sum({<ACCOUNT = {'A'}>}[# BALANCE]), [Year-Period]), -Aggr([Year-Period], [Year-Period]))
- Mark as New
- Bookmark
- Subscribe
- Mute
- Subscribe to RSS Feed
- Permalink
- Report Inappropriate Content
Thanks Sunny, that's it!