Unlock a world of possibilities! Login now and discover the exclusive benefits awaiting you.
- Qlik Community
- :
- All Forums
- :
- QlikView App Dev
- :
- Re: How to center column titles in charts?
- Subscribe to RSS Feed
- Mark Topic as New
- Mark Topic as Read
- Float this Topic for Current User
- Bookmark
- Subscribe
- Mute
- Printer Friendly Page
- Mark as New
- Bookmark
- Subscribe
- Mute
- Subscribe to RSS Feed
- Permalink
- Report Inappropriate Content
How to center column titles in charts?
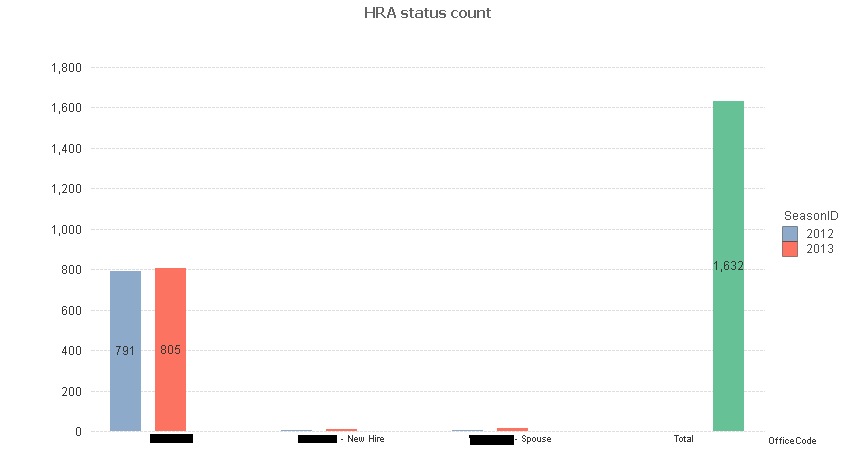
I have this issue when I create a chart where if go to Dimension Limits and select "Show Total," the column names are not aligned properly. Aethestically, it looks very weird. You can see in this example that the "Total" for the total bar is not directly under the column.
Is there any way to prevent this or somehow align them properly? Thanks!
Accepted Solutions
- Mark as New
- Bookmark
- Subscribe
- Mute
- Subscribe to RSS Feed
- Permalink
- Report Inappropriate Content
Actually the labels are centered. You get three bars for every dimension value. It's just that the Total bar is only shown for the 'fake' Total dimension value, but space is reserved for it for all dimension values. And for the Total value there is space reserved for the bars for 2012 and 2013. I agree this is far from optimal, but the chart engine is somewhat limited in some things. I think your chart is better of without the Total from the dimension limits.
talk is cheap, supply exceeds demand
- Mark as New
- Bookmark
- Subscribe
- Mute
- Subscribe to RSS Feed
- Permalink
- Report Inappropriate Content
Hi find the image above to make the changes
Thanks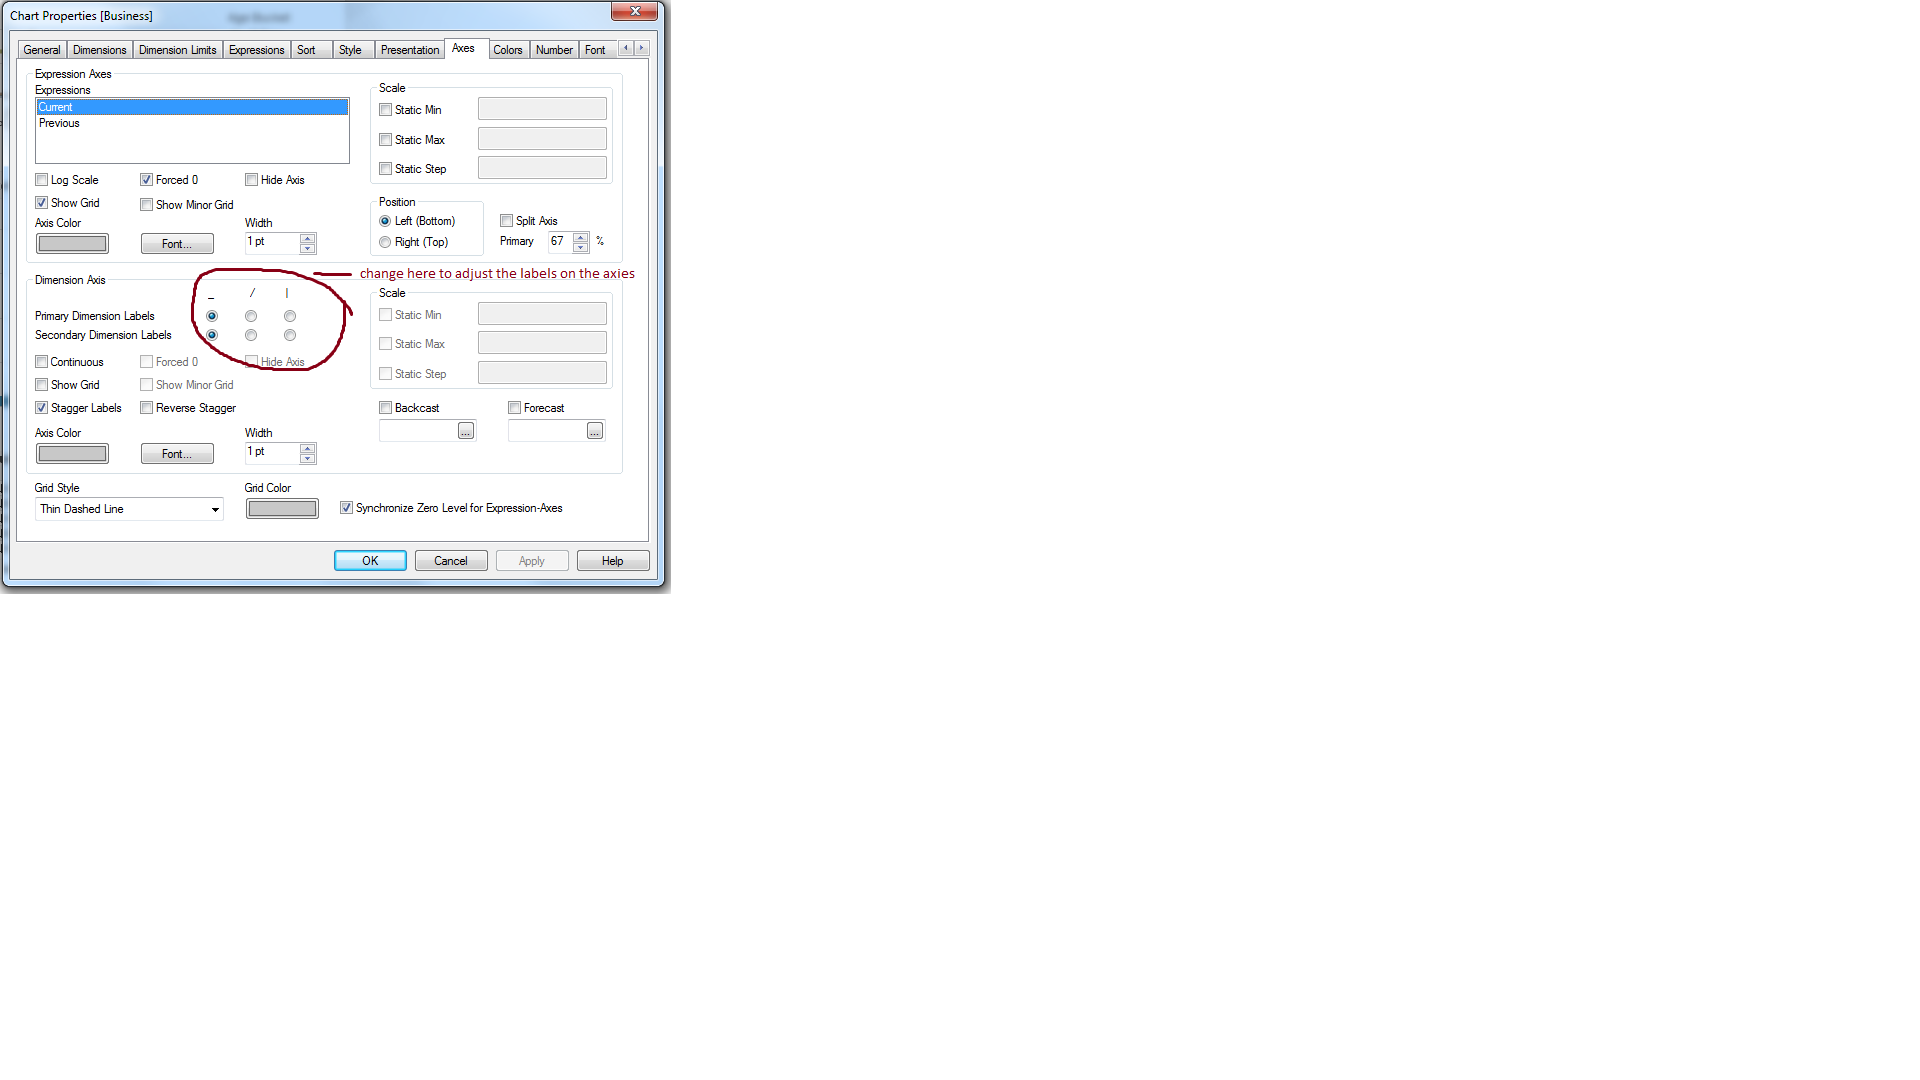
- Mark as New
- Bookmark
- Subscribe
- Mute
- Subscribe to RSS Feed
- Permalink
- Report Inappropriate Content
Unfortunately, the names are still not aligned correctly when I try those options.
- Mark as New
- Bookmark
- Subscribe
- Mute
- Subscribe to RSS Feed
- Permalink
- Report Inappropriate Content
if possible could u please post a sample file
so that i can look into that..
Thanks
- Mark as New
- Bookmark
- Subscribe
- Mute
- Subscribe to RSS Feed
- Permalink
- Report Inappropriate Content
Actually the labels are centered. You get three bars for every dimension value. It's just that the Total bar is only shown for the 'fake' Total dimension value, but space is reserved for it for all dimension values. And for the Total value there is space reserved for the bars for 2012 and 2013. I agree this is far from optimal, but the chart engine is somewhat limited in some things. I think your chart is better of without the Total from the dimension limits.
talk is cheap, supply exceeds demand
- Mark as New
- Bookmark
- Subscribe
- Mute
- Subscribe to RSS Feed
- Permalink
- Report Inappropriate Content
Ah, I get it. I noticed that when I took off the additional dimension, that the labels became center aligned. Thanks!