Unlock a world of possibilities! Login now and discover the exclusive benefits awaiting you.
- Qlik Community
- :
- All Forums
- :
- QlikView App Dev
- :
- Re: How to change the measure units like 20K or 20...
- Subscribe to RSS Feed
- Mark Topic as New
- Mark Topic as Read
- Float this Topic for Current User
- Bookmark
- Subscribe
- Mute
- Printer Friendly Page
- Mark as New
- Bookmark
- Subscribe
- Mute
- Subscribe to RSS Feed
- Permalink
- Report Inappropriate Content
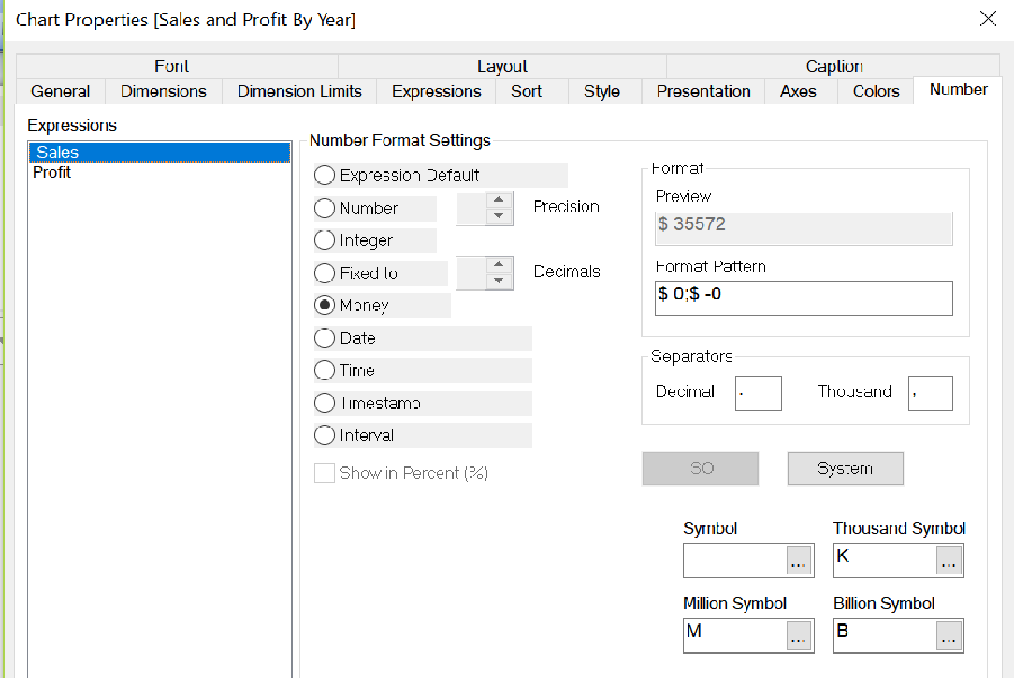
How to change the measure units like 20K or 20 M or 20 B depending on the data vollume?
Hi,
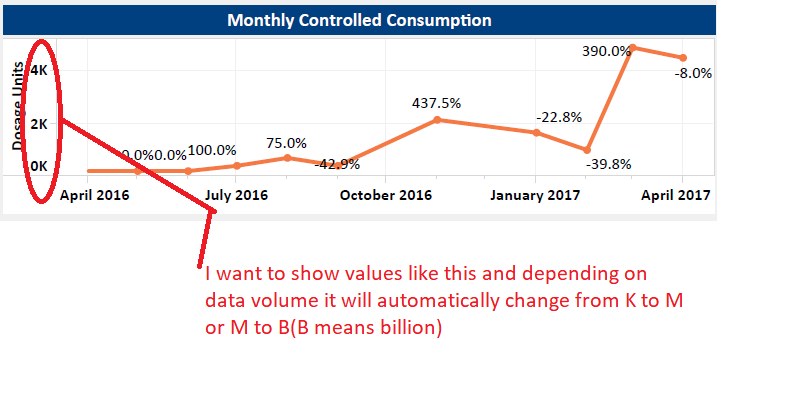
I want to show the values as 24k or 24M depending on the volume of data values. So my measure units(Like K for thousands, M for Millions, B for Billions) will be changed dynamically. So how can i achieve this?
Below are 2 reference:
and I want to achieve the below screenshot:-
- Mark as New
- Bookmark
- Subscribe
- Mute
- Subscribe to RSS Feed
- Permalink
- Report Inappropriate Content
Same tab, slightly off to the side:

- Mark as New
- Bookmark
- Subscribe
- Mute
- Subscribe to RSS Feed
- Permalink
- Report Inappropriate Content
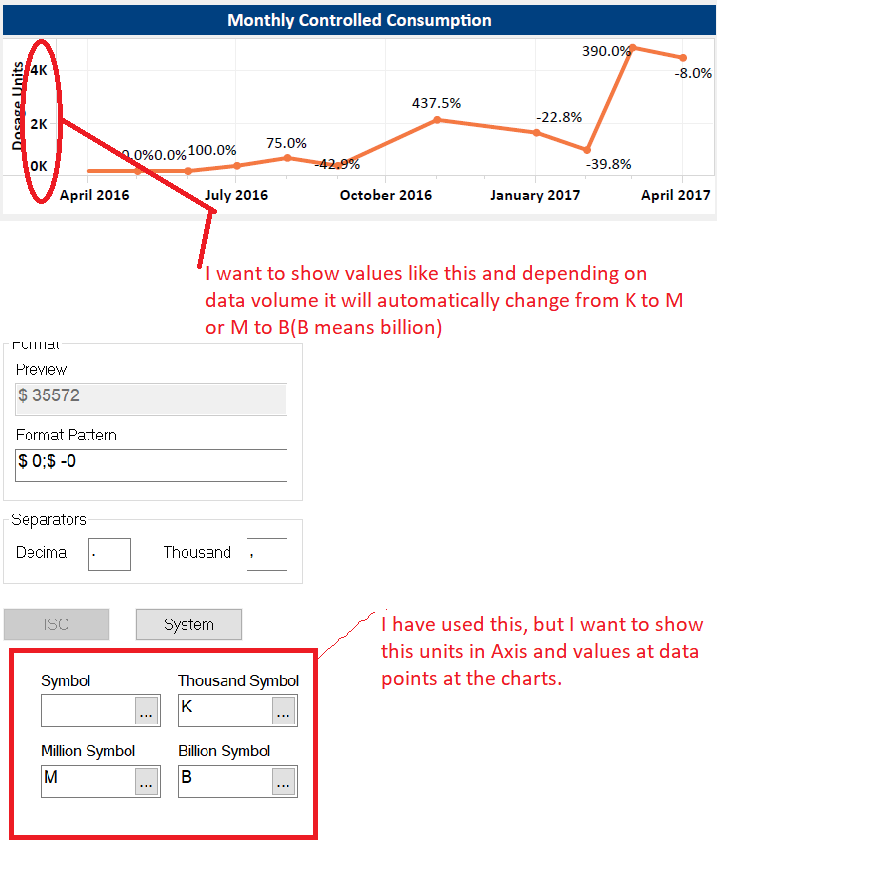
Hi,
I have used symbols , but I want to show those symbols at the Axis Label and also in the values of data points in the chart.
Below screenshots id for reference:-
- Mark as New
- Bookmark
- Subscribe
- Mute
- Subscribe to RSS Feed
- Permalink
- Report Inappropriate Content
I am not aware of any way to configure where and how the symbol appears in QlikView - it will always appear to the side (or top) of the axis.
You might be able to get the method linked here to work using nested if() to set the format (divide by 1000 and append K, divide by 1000000 and append M, etc based on value). Not sure if it'd work or not, but I can't think of another way.
http://qlikviewcookbook.com/2015/05/currency-and-other-symbols-on-the-y-axis/