Unlock a world of possibilities! Login now and discover the exclusive benefits awaiting you.
- Qlik Community
- :
- All Forums
- :
- QlikView App Dev
- :
- Re: How to combine two column in this scenario
- Subscribe to RSS Feed
- Mark Topic as New
- Mark Topic as Read
- Float this Topic for Current User
- Bookmark
- Subscribe
- Mute
- Printer Friendly Page
- Mark as New
- Bookmark
- Subscribe
- Mute
- Subscribe to RSS Feed
- Permalink
- Report Inappropriate Content
How to combine two column in this scenario
Hi Team,
I have some sample data.
| Team 1 | Team 2 | Winner |
| Srilanka | India | India |
| Pakistan | India | Pakistan |
| India | Srilanka | Srilanka |
| India | England | India |
| India | Pakistan | India |
| China | India | India |
Result-
Srilanka - 2 Match
Pakistan- 2 Match
China- 1 Match
England- 1 Match
Requirement :
I want to show in bar chart.
How many matches has India played against different teams?
please any one give some suggestion
- Mark as New
- Bookmark
- Subscribe
- Mute
- Subscribe to RSS Feed
- Permalink
- Report Inappropriate Content
Something like this?
Script
Table:
LOAD * INLINE [
Team 1, Team 2, Winner
Srilanka, India, India
Pakistan, India, Pakistan
India, Srilanka, Srilanka
India, England, India
India, Pakistan, India
China, India, India
];
Dim:
LOAD * Inline [
Dim
1
2
];
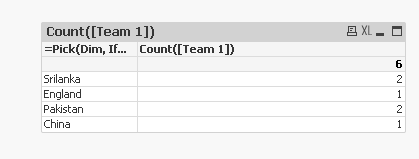
Straight table with
Dimension
=Pick(Dim, If([Team 1] = 'India', [Team 2]), If([Team 2] = 'India', [Team 1]))
Expression
Count([Team 1])
- Mark as New
- Bookmark
- Subscribe
- Mute
- Subscribe to RSS Feed
- Permalink
- Report Inappropriate Content
you could try a graph with
=if(wildmatch(Team1,'*India*'),Team2,
if(wildmatch(Team2,'*India*'),Team1,'')
)
as dimension
and
sum(1)
as measure
- Mark as New
- Bookmark
- Subscribe
- Mute
- Subscribe to RSS Feed
- Permalink
- Report Inappropriate Content
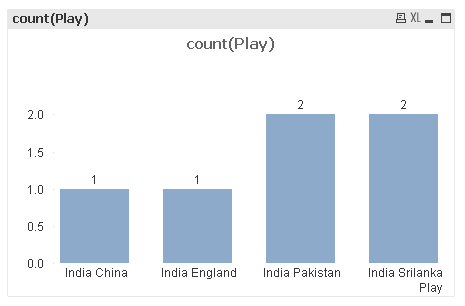
I am trying this in Backend it works hope so it will help you
e.g.
Match:
load *,
India&' '&Other as Play;
load *,
if(WildMatch([Team 1],'India') or WildMatch([Team 2],'India'),'India') as India,
if(SubField(Match,' ',1)<>'India',subfield(Match,' ',1),
if(SubField(Match,' ',2)<>'India',subfield(Match,' ',2))) as Other;
load *,
[Team 1]&' '&[Team 2] as Match inline [
Team 1, Team 2, Winner
Srilanka, India, India
Pakistan, India, Pakistan
India, Srilanka, Srilanka
India, England, India
India, Pakistan, India
China, India, India
];
- Mark as New
- Bookmark
- Subscribe
- Mute
- Subscribe to RSS Feed
- Permalink
- Report Inappropriate Content
Result:
Noconcatenate Load Team1 as Team resident Table
where WildMatch(Team2,'India')
Concatenate (Result)
Load Team2 as Team resident Table
where WildMatch(Team2,'India')
And then you just have to count occurences