Unlock a world of possibilities! Login now and discover the exclusive benefits awaiting you.
- Qlik Community
- :
- All Forums
- :
- QlikView App Dev
- :
- Re: How to compare fields
- Subscribe to RSS Feed
- Mark Topic as New
- Mark Topic as Read
- Float this Topic for Current User
- Bookmark
- Subscribe
- Mute
- Printer Friendly Page
- Mark as New
- Bookmark
- Subscribe
- Mute
- Subscribe to RSS Feed
- Permalink
- Report Inappropriate Content
How to compare fields
Guys,
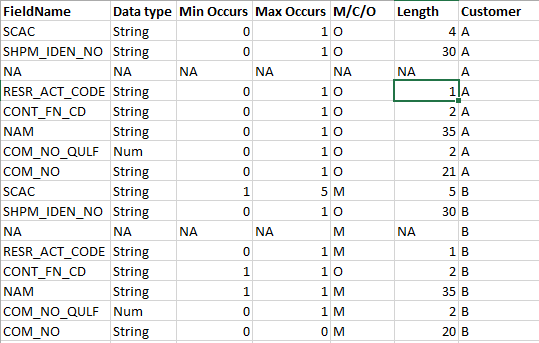
In the below screenshot, I have two customers A and B with having some number of fields each.
1. When customer A is selected in list-box,I want to show a bar chart with having the fields exactly matched with customer B
2. The selected customer (A) need not be shown in bar chart. If selected customer's fields exactly matches with customer B, that matched field count alone for customer B should be shown.
How can I achieve this... Plz anyone help me guys.
Regards,
Siva
- « Previous Replies
- Next Replies »
Accepted Solutions
- Mark as New
- Bookmark
- Subscribe
- Mute
- Subscribe to RSS Feed
- Permalink
- Report Inappropriate Content
Check now
- Mark as New
- Bookmark
- Subscribe
- Mute
- Subscribe to RSS Feed
- Permalink
- Report Inappropriate Content
1) On what bases?
2) Does it mean this?
Only({<Customer = {B} >} Yourdatapointfieldname)
- Mark as New
- Bookmark
- Subscribe
- Mute
- Subscribe to RSS Feed
- Permalink
- Report Inappropriate Content
No,If we have three customers A,B and C, and if customer A is selected we have to show the matched fields count for customers excluding the selected customer A i.e Customer B and C.
But all the fields should be matched with customer A. Also attached sample data.
Here, in below example we have 3 customers,
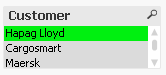
"Hapag Lloyd" is selected and I need the matched fields count in "Cargosmart" and "Maersk" as shown below.
Hapag Lloyd - 8 fields
Cargosmart - 10 fields and
Maersk - 6 fields
Out of 10 fields of Cargosmart, 5 fields matched with Hapag Lloyd and out of 6 fields of Maersk, 4 fields matched with Hapag Lloyd as shown in the chart below.

I need to show this chart based on the appropriate selections of customer.
It has to compare the matched fields with all the customers excluding the selected customer.
- Mark as New
- Bookmark
- Subscribe
- Mute
- Subscribe to RSS Feed
- Permalink
- Report Inappropriate Content
I haven't check your excel file, May be this?
Sum({<Customer = E(Customer)>}Sales)
- Mark as New
- Bookmark
- Subscribe
- Mute
- Subscribe to RSS Feed
- Permalink
- Report Inappropriate Content
Yes, I have checked P() and E() function in the expressions.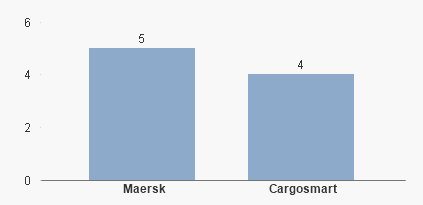
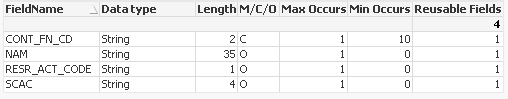
If "Maersk" is selected in this bar chart, that 5 fields to be displayed in a table and if "Cargosmart" is selected, 4 fields to be displayed in a table.
I couldn't achieve this drill-down because of using E() function.
Is there any way to achieve this also?
- Mark as New
- Bookmark
- Subscribe
- Mute
- Subscribe to RSS Feed
- Permalink
- Report Inappropriate Content
I am confused again, This is the case why you need E() function?? Will you able to provide sample application?
- Mark as New
- Bookmark
- Subscribe
- Mute
- Subscribe to RSS Feed
- Permalink
- Report Inappropriate Content
Attached the sample file.
- Mark as New
- Bookmark
- Subscribe
- Mute
- Subscribe to RSS Feed
- Permalink
- Report Inappropriate Content
Please explain now, If you are not selecting any thing report gets no data. If you select some thing what are you expecting? Please mention Numbers
- Mark as New
- Bookmark
- Subscribe
- Mute
- Subscribe to RSS Feed
- Permalink
- Report Inappropriate Content
If Hapag Lloyd is selected, I've got the exactly matched fields count of Cargosmart(4) and Maersk(5).
When it is drill-downed further i.e if Cargosmart is selected in the bar chart, I need to get that 4 fields and similarly for Maersk, 5 fields in a table and bar chart has to be hidden.
Could you please suggest some other way to achieve this?
- Mark as New
- Bookmark
- Subscribe
- Mute
- Subscribe to RSS Feed
- Permalink
- Report Inappropriate Content
What my understand is If you are selecting Hapag Lloyd from Customer. You want to exclude that selection from Chart and the if we drill down or selection happen on Bar graph you want to get straight table like below, Is that you are looking?
- « Previous Replies
- Next Replies »