Unlock a world of possibilities! Login now and discover the exclusive benefits awaiting you.
- Qlik Community
- :
- All Forums
- :
- QlikView App Dev
- :
- How to count distinct users avoiding some dimensio...
- Subscribe to RSS Feed
- Mark Topic as New
- Mark Topic as Read
- Float this Topic for Current User
- Bookmark
- Subscribe
- Mute
- Printer Friendly Page
- Mark as New
- Bookmark
- Subscribe
- Mute
- Subscribe to RSS Feed
- Permalink
- Report Inappropriate Content
How to count distinct users avoiding some dimensions?
Hello everyone and thank you for your time.
I am trying to calculate the ratio of cache failures and unique users every day (dimension) and also per Country (dimension).
Input data is something like that:
| Country | Date | ErrorType | user |
| Argentina | 01/10/2016 | Cache | 1 |
| Spain | 01/10/2016 | Network | 2 |
| Argentina | 01/10/2016 | Comm | 1 |
| Spain | 01/10/2016 | 3 | |
| Spain | 01/10/2016 | Comm | 2 |
| Spain | 02/10/2016 | 3 | |
| Argentina | 02/10/2016 | Cache | 1 |
| Argentina | 02/10/2016 | Cache | 1 |
| Spain | 02/10/2016 | 2 | |
| Spain | 02/10/2016 | Network | 2 |
| Argentina | 02/10/2016 | 1 | |
| Argentina | 03/10/2016 | Network | 1 |
| Spain | 03/10/2016 | 2 | |
| Spain | 03/10/2016 | 3 | |
| Spain | 03/10/2016 | Cache | 3 |
| Argentina | 03/10/2016 | Network | 1 |
| Spain | 03/10/2016 | 2 | |
| Spain | 03/10/2016 | Comm | 3 |
As said, I'd like to calculate the ratio between Cache failures (there are more failure types) and total distinct users everyday (with and without failure), and i am only able to calculate unique users with Cache failures, which is not the correct calculation.
I have calculate it on Excel to exactly know what I need (and what I mean). This first table is the number of Cache failures per Country and per Date:
| Cache Failures | |
| Argentina | |
| 01/10/2016 | 1 |
| 02/10/2016 | 2 |
| 03/10/2016 | 0 |
| Spain | |
| 01/10/2016 | 0 |
| 02/10/2016 | 0 |
| 03/10/2016 | 1 |
Next, I have counted distinct users per Country and Date:
| Distinct user count | |
| Argentina | |
| 01/10/2016 | 1 |
| 02/10/2016 | 1 |
| 03/10/2016 | 1 |
| Spain | |
| 01/10/2016 | 2 |
| 02/10/2016 | 2 |
| 03/10/2016 | 2 |
Finally, by dividing the correct data from each table, we get the ratio between the daily failures in each country and the daily distinct users per country.
| Cache failures | Unique users | Cache failure vs distinct users | |
| Argentina | |||
| 01/10/2016 | 1 | 1 | 100% |
| 02/10/2016 | 2 | 1 | 200% |
| 03/10/2016 | 0 | 1 | 0% |
| Spain | |||
| 01/10/2016 | 0 | 2 | 0% |
| 02/10/2016 | 0 | 2 | 0% |
| 03/10/2016 | 1 | 2 | 50% |
Is there a way to perform it in a graph or a pivot table? I was able to count the failures, but the percentage was not ok due to the bad calculation of users (because it was calculating unique users per Country, day and Error Type, and not only per Country and day). I think this is the main problem, but I am not totallly sure about it. For example, regarding Spain, the 03/10/2016 it was 1 cache failure (it occured to user 3). In QV I am obtaining a 100% cacher failure percentage (cause there was 1 cache failure and it affected just 1 user), but that's not what I am looking for, because in Spain the 03/10/2016 there were 2 distinct users, and that's why (in Excel) we should get 50% of cache failure that day in Spain.
Hope I have explained it in a correct way and you can help me, and if you have any questions regarding the explanation of the issue, feel free to ask me.
Again, thank you very much for your help!
Jose
Accepted Solutions
- Mark as New
- Bookmark
- Subscribe
- Mute
- Subscribe to RSS Feed
- Permalink
- Report Inappropriate Content
This?
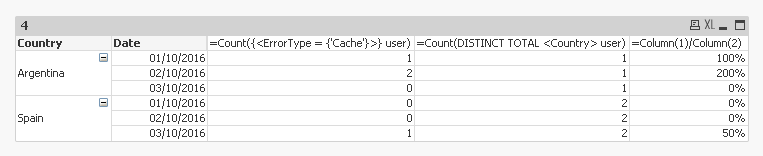
Expressions
=Count({<ErrorType = {'Cache'}>} user)
=Count(DISTINCT TOTAL <Country> user)
=Column(1)/Column(2)
- Mark as New
- Bookmark
- Subscribe
- Mute
- Subscribe to RSS Feed
- Permalink
- Report Inappropriate Content
This?
Expressions
=Count({<ErrorType = {'Cache'}>} user)
=Count(DISTINCT TOTAL <Country> user)
=Column(1)/Column(2)
- Mark as New
- Bookmark
- Subscribe
- Mute
- Subscribe to RSS Feed
- Permalink
- Report Inappropriate Content
Hello Sunny T, thank you very much for your response!
Ot was almost exactly what I was looking for, but thanks to you I did it!
Basically, in the second expression, it was needed to add Date dimension:
=Count(DISTINCT TOTAL <Country,Date> user)
and that's all.
Thank you again!
- Mark as New
- Bookmark
- Subscribe
- Mute
- Subscribe to RSS Feed
- Permalink
- Report Inappropriate Content
As long as your got what you were looking for, I am all good 
Best,
Sunny