Unlock a world of possibilities! Login now and discover the exclusive benefits awaiting you.
- Qlik Community
- :
- All Forums
- :
- QlikView App Dev
- :
- How to create Dashboard ,analysis and report with ...
- Subscribe to RSS Feed
- Mark Topic as New
- Mark Topic as Read
- Float this Topic for Current User
- Bookmark
- Subscribe
- Mute
- Printer Friendly Page
- Mark as New
- Bookmark
- Subscribe
- Mute
- Subscribe to RSS Feed
- Permalink
- Report Inappropriate Content
How to create Dashboard ,analysis and report with in single sheet
Hi all,
i want to achieve some thing like this... how i can do this?
Thanks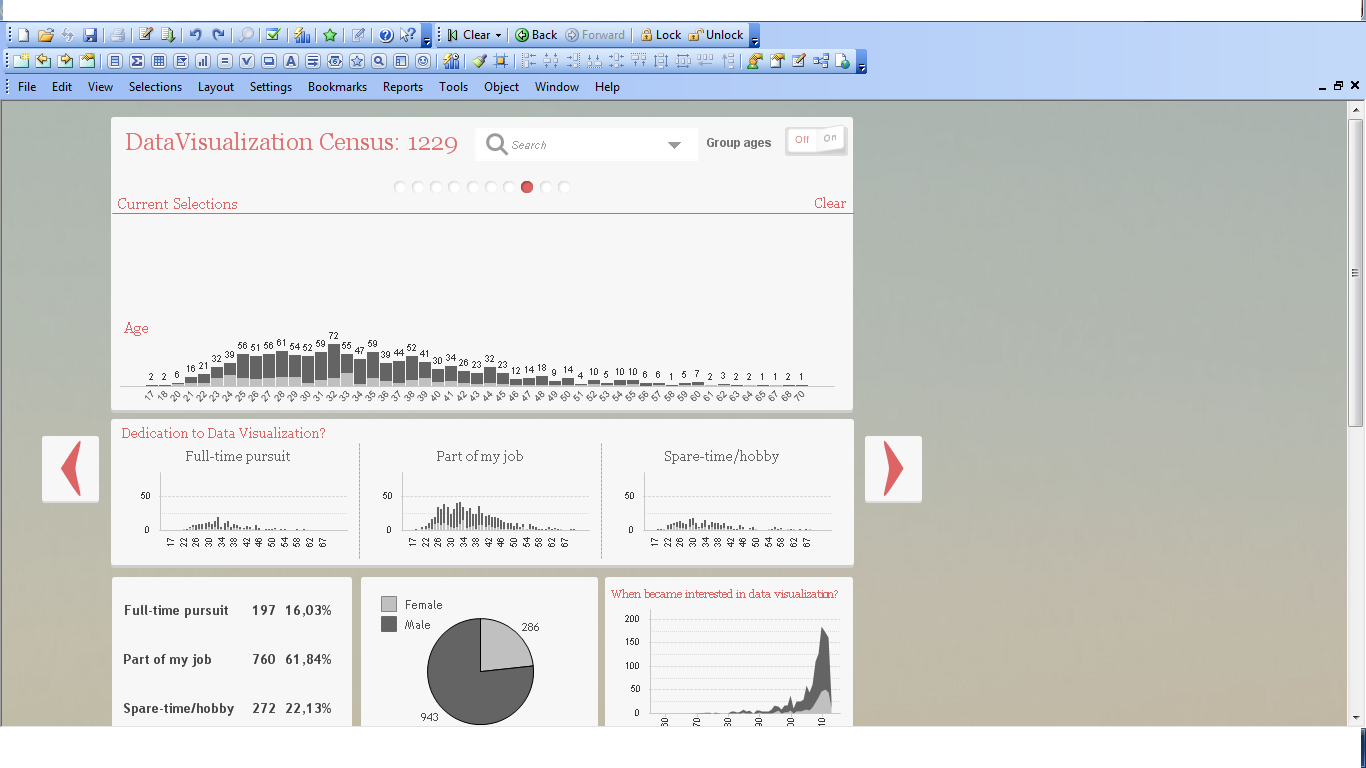
- Mark as New
- Bookmark
- Subscribe
- Mute
- Subscribe to RSS Feed
- Permalink
- Report Inappropriate Content
Why do you want to do it in one sheet? Why not use more sheets but hide the tabrow and use buttons to navigate between the sheets?
talk is cheap, supply exceeds demand
- Mark as New
- Bookmark
- Subscribe
- Mute
- Subscribe to RSS Feed
- Permalink
- Report Inappropriate Content
Hi,
You have to use Variables, Buttons and Conditional Show/hide of object based on the variable value by using
Object Properties -> Layout-> Show Conditional and specify variable.
Check this links
youtube.com/watch?v=PSRBtw7SYD8
learnqlickview.com/the-conditional-show-in-qlikview/
quickintelligence.co.uk/qlikview-buttons/
Hope this helps you.
Regards,
Jagan.
- Mark as New
- Bookmark
- Subscribe
- Mute
- Subscribe to RSS Feed
- Permalink
- Report Inappropriate Content
While it is tough to explain you all details with example here, let me tell you the core of the concept. Most of the objects are enabled with conditional appearance. Wherever you find a clickable object, goto the properties and check that it's actually conditionally enabled. On click there would be trigger set - possibly a variable value is set, and that variable value is used to control the visibility of the objects.
Check the documents and explore - hope that would help you figure out how to proceed.
- Mark as New
- Bookmark
- Subscribe
- Mute
- Subscribe to RSS Feed
- Permalink
- Report Inappropriate Content
One idea i have:
- You can set variable where the variable will increase in number depending on number of pages you want.
- For variable,You can use mod similar to programming to make sure that it doesnt go to negative (not to sure if this is possible in Qlikview, have not tried but it should be)
- The button, you can make it +/- to the variable for e.g vPageNumber+=1 (you need to find out how it's done in Qlikview)
- The charts can be placed inside container(s) to organize them nicely or you can just place it as you wish
- The page change will only happen when you go to the chart.. Properties>Layout.. Check the conditional and set the vPageNumber= 1 for example. Hence it will only display if vPageNumber is 1. and if vPageNumber=2, it will display if page number is 2.
- For group ages, i am not too sure but i guess you can import images.
- For the buttons on top, you can also set it to variables to set the current page number.
Very dry and boring but i hope this gives you a guide on what you should be searching on.
Hope it helps.
- Mark as New
- Bookmark
- Subscribe
- Mute
- Subscribe to RSS Feed
- Permalink
- Report Inappropriate Content
Hi
This can be created by two ways -
One as you said on single sheet (But then you have to play with show-hide charts + multiple variables & it will become more complex when more no of slides are there.
Second way it to create multiple sheets with exact similar background n all except charts & hide tab-rows to give a feel like a playing on single page/sheet to user. This is more simpler solution comparative to earlier on almost no extra variable is needed.
All the Best.
--
Regards,
Prashant P Baste
- Mark as New
- Bookmark
- Subscribe
- Mute
- Subscribe to RSS Feed
- Permalink
- Report Inappropriate Content
Is there no way that he can incrementally add value to the variable?