Unlock a world of possibilities! Login now and discover the exclusive benefits awaiting you.
- Qlik Community
- :
- All Forums
- :
- QlikView App Dev
- :
- Re: How to create LOW MEDIUM HIGH bar chart with Y...
- Subscribe to RSS Feed
- Mark Topic as New
- Mark Topic as Read
- Float this Topic for Current User
- Bookmark
- Subscribe
- Mute
- Printer Friendly Page
- Mark as New
- Bookmark
- Subscribe
- Mute
- Subscribe to RSS Feed
- Permalink
- Report Inappropriate Content
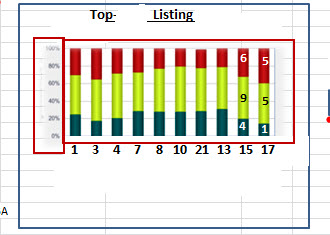
How to create LOW MEDIUM HIGH bar chart with Y-axis 0-100% & number value in the data points
Hi guys,
I need to create a bar chart as below, has anyone done it before? any advise?
- i have a top 20 list - field = top_list dimension & 1 rating (low, medium, high) dimension
- 1 expression, count(record_number)
- each of the bar must up to 100%
- the low medium high segment short and long , depends on the count of record number.
Rgds
Jim
- Tags:
- bar chart
Accepted Solutions
- Mark as New
- Bookmark
- Subscribe
- Mute
- Subscribe to RSS Feed
- Permalink
- Report Inappropriate Content
see attached
If a post helps to resolve your issue, please accept it as a Solution.
- Mark as New
- Bookmark
- Subscribe
- Mute
- Subscribe to RSS Feed
- Permalink
- Report Inappropriate Content
There is no native QV Option to show absolute numbers within a percentage axis! Thats why you need to create an extra transparent chart with invisible expressions and overlay this to the existing chart!
See attached file for workaround!
hope this helps
- Mark as New
- Bookmark
- Subscribe
- Mute
- Subscribe to RSS Feed
- Permalink
- Report Inappropriate Content
i saw your qvw file. u r using expression:
(count({<Rating={'HIGH'}>}Category))/count(Category)
y cannot (count({<Rating={'HIGH'}>}Category))/count( TOTAL Category)
???
- Mark as New
- Bookmark
- Subscribe
- Mute
- Subscribe to RSS Feed
- Permalink
- Report Inappropriate Content
that was just to get the proportions and the percentage axis for the transparent chart.
Perhaps the attached solution might be better but the probleme will be to fit the absolute numbers to the
corresponding bar. perhaps someone has a better solution....
- Mark as New
- Bookmark
- Subscribe
- Mute
- Subscribe to RSS Feed
- Permalink
- Report Inappropriate Content
USE a DUAL expression, there is no need to overlay a transparent chart
can you post a data sample to demonstrate
If a post helps to resolve your issue, please accept it as a Solution.
- Mark as New
- Bookmark
- Subscribe
- Mute
- Subscribe to RSS Feed
- Permalink
- Report Inappropriate Content
see attached
If a post helps to resolve your issue, please accept it as a Solution.