Unlock a world of possibilities! Login now and discover the exclusive benefits awaiting you.
- Qlik Community
- :
- All Forums
- :
- QlikView App Dev
- :
- How to create a Stacked bar chart with 1 dimension...
- Subscribe to RSS Feed
- Mark Topic as New
- Mark Topic as Read
- Float this Topic for Current User
- Bookmark
- Subscribe
- Mute
- Printer Friendly Page
- Mark as New
- Bookmark
- Subscribe
- Mute
- Subscribe to RSS Feed
- Permalink
- Report Inappropriate Content
How to create a Stacked bar chart with 1 dimension and 4 expressions
Hi,
I need help creating the below bar chart
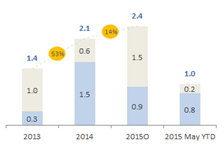
3 bars : Blue - US sales for 2013,2014,2015; Gray - Europe sales for 2013,2014,2015; Stacked based on the year.
1 bar: For 2015,US outlook(in blue) and Europe outlook(in gray) are stacked.
I have Year as dimension and 4 expressions 1 for US sales, 1 for Europe Sales, 1 for US outlook and 1 for Europe outlook.
Can someone help me create this bar chart asap.
Thanks!
- Tags:
- new_to_qlikview
- « Previous Replies
-
- 1
- 2
- Next Replies »
- Mark as New
- Bookmark
- Subscribe
- Mute
- Subscribe to RSS Feed
- Permalink
- Report Inappropriate Content
- Mark as New
- Bookmark
- Subscribe
- Mute
- Subscribe to RSS Feed
- Permalink
- Report Inappropriate Content
Check the attachemnt...
Take Year as Dim and write your 4 expression...
then Properties -> Style -> Subtype -> Stacked..
- Mark as New
- Bookmark
- Subscribe
- Mute
- Subscribe to RSS Feed
- Permalink
- Report Inappropriate Content
HI,
Select Stacked option in
Chart Properties -> Style -> Stacked option.
Regards,
Jagan.
- Mark as New
- Bookmark
- Subscribe
- Mute
- Subscribe to RSS Feed
- Permalink
- Report Inappropriate Content
Hi Add the dimension and 4 expressions then Select the Stacked option in the Style tab Chart Properties -> Style -> Stacked option. Regards Deepak
- Mark as New
- Bookmark
- Subscribe
- Mute
- Subscribe to RSS Feed
- Permalink
- Report Inappropriate Content
Hi,
Attached a sample qvw file which satisfies your request.
Hope this will help you.
Regards,
Leni Balakrishnan
- Mark as New
- Bookmark
- Subscribe
- Mute
- Subscribe to RSS Feed
- Permalink
- Report Inappropriate Content
Please provide the sample data
- Mark as New
- Bookmark
- Subscribe
- Mute
- Subscribe to RSS Feed
- Permalink
- Report Inappropriate Content
Hi,
Check this,
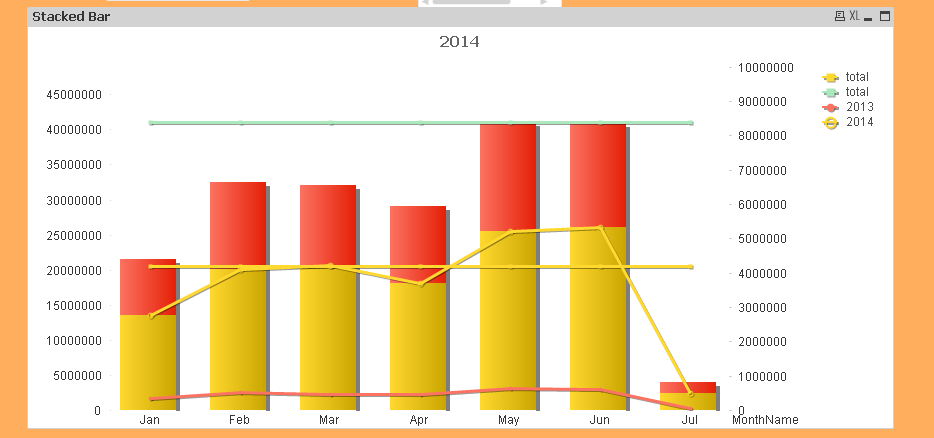
Here:
Dimension:
Month
Expressions:
2013 Sales - Expression Back Ground Color- light Blue()
2014 Sales - Expression Back Ground Color- DarkGray()
Total Sales
Total/2 Sales
Make In Expression Axes For one Axes -> Position -> Right(Top)
Do Check this App,
PFA,
-Hirish
- Mark as New
- Bookmark
- Subscribe
- Mute
- Subscribe to RSS Feed
- Permalink
- Report Inappropriate Content
Attached my qvw, please take a look a suggest me what needs to be done.
Thanks!
- Mark as New
- Bookmark
- Subscribe
- Mute
- Subscribe to RSS Feed
- Permalink
- Report Inappropriate Content
HI,
See the attached qvw .
- « Previous Replies
-
- 1
- 2
- Next Replies »