Unlock a world of possibilities! Login now and discover the exclusive benefits awaiting you.
- Qlik Community
- :
- All Forums
- :
- QlikView App Dev
- :
- How to create a Stacked bar chart with 1 dimension...
- Subscribe to RSS Feed
- Mark Topic as New
- Mark Topic as Read
- Float this Topic for Current User
- Bookmark
- Subscribe
- Mute
- Printer Friendly Page
- Mark as New
- Bookmark
- Subscribe
- Mute
- Subscribe to RSS Feed
- Permalink
- Report Inappropriate Content
How to create a Stacked bar chart with 1 dimension and 4 expressions
Hi,
I need help creating the below bar chart
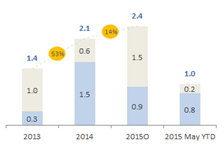
3 bars : Blue - US sales for 2013,2014,2015; Gray - Europe sales for 2013,2014,2015; Stacked based on the year.
1 bar: For 2015,US outlook(in blue) and Europe outlook(in gray) are stacked.
I have Year as dimension and 4 expressions 1 for US sales, 1 for Europe Sales, 1 for US outlook and 1 for Europe outlook.
Can someone help me create this bar chart asap.
Thanks!
- Tags:
- new_to_qlikview
- « Previous Replies
-
- 1
- 2
- Next Replies »
- Mark as New
- Bookmark
- Subscribe
- Mute
- Subscribe to RSS Feed
- Permalink
- Report Inappropriate Content
to start, you would create a bar chart with 1 dimension and 4 expressions. You would then go to style tab of the bar chart and select stacked.
if you want the colors based on the value of the diemsnion you would go to the expressions tab, expand the expression and select background color. Write an expression for background color
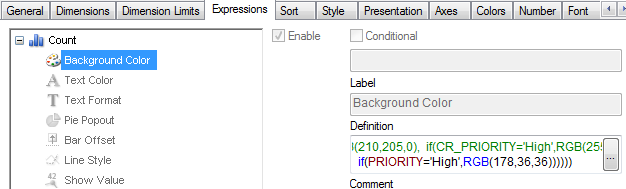
the example below is using the dimesion Priority and basing the stacked colors based on the value
=(if(PRIORITY='Urgent',RGB(255,0,0), if(PRIORITY='Low',RGB(0,128,0), if(PRIORITY='Medium',RGB(239,179,118), if(PRIORITY='High',RGB(178,36,36))))))
- « Previous Replies
-
- 1
- 2
- Next Replies »