Unlock a world of possibilities! Login now and discover the exclusive benefits awaiting you.
- Qlik Community
- :
- All Forums
- :
- QlikView App Dev
- :
- Re: How to create a trend line with data that is u...
- Subscribe to RSS Feed
- Mark Topic as New
- Mark Topic as Read
- Float this Topic for Current User
- Bookmark
- Subscribe
- Mute
- Printer Friendly Page
- Mark as New
- Bookmark
- Subscribe
- Mute
- Subscribe to RSS Feed
- Permalink
- Report Inappropriate Content
How to create a trend line with data that is updating regularly?
Hello,
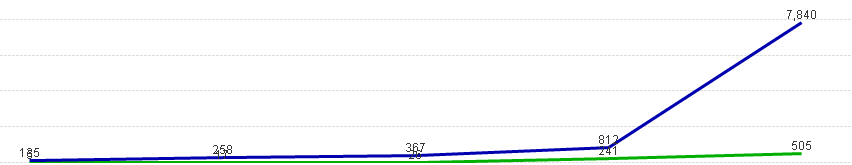
I'm trying to create a trend line by month of data that is updating weekly. Below is the calculation used for something to be considered in "compliance". i want to use this to show what was in compliance for each week for the past month, while the other charts update using the weekly data. see picture below for my concern, the most current week consistently is spiking.
= Count({< WRK_STATUS = {3} >} IF(LoginDate >= Date(Today()-7 , 'MM/DD/YYYY') AND LoginDate <= Date(Today(), 'MM/DD/YYYY'), WRK_STATUS))
Thanks
- Mark as New
- Bookmark
- Subscribe
- Mute
- Subscribe to RSS Feed
- Permalink
- Report Inappropriate Content
May be this?
=Count({$< WRK_STATUS = {3}, Month= ,Year = {'$(=Max(Year))'}, LoginDate = {">=$(=Date(Today()-7 , 'MM/DD/YYYY')) <=$(=Date(Today(), 'MM/DD/YYYY'))"} >} WRK_STATUS)
- Mark as New
- Bookmark
- Subscribe
- Mute
- Subscribe to RSS Feed
- Permalink
- Report Inappropriate Content
This didn't work, but would this "freeze" the data so it retains historical data while the rest of the file keeps reloading?