Unlock a world of possibilities! Login now and discover the exclusive benefits awaiting you.
- Qlik Community
- :
- All Forums
- :
- QlikView App Dev
- :
- Re: How to create dimension to show the range
- Subscribe to RSS Feed
- Mark Topic as New
- Mark Topic as Read
- Float this Topic for Current User
- Bookmark
- Subscribe
- Mute
- Printer Friendly Page
- Mark as New
- Bookmark
- Subscribe
- Mute
- Subscribe to RSS Feed
- Permalink
- Report Inappropriate Content
How to create dimension to show the range
Hello Everyone,
I have below scenario:
I have attendee count and expenses, both are measures.
I need to create a chart having range as a dimension, means from 0-10 attendees what is the sum(expenses), for 10-20 what is the sum like that till 90-100.
in x axis i need to show 0-10 to 90-100 values, this one i need to calculate from count
any suggestions please
Thanks in advance
Regards,
Sreeharsha V
- Mark as New
- Bookmark
- Subscribe
- Mute
- Subscribe to RSS Feed
- Permalink
- Report Inappropriate Content
Try this Dim and Expre
Dim:- =Replace(Class(Attendees,10),'<= x <', '-')
Expre:- sum(expenses)
Regards
Anand
- Mark as New
- Bookmark
- Subscribe
- Mute
- Subscribe to RSS Feed
- Permalink
- Report Inappropriate Content
Thank you so much Arul,
That is wonderful,
Can you please help me if i wanna see below values on x-axis
10-20
20-30
30-50
>50
Regards,
Sreeharsha.
- Mark as New
- Bookmark
- Subscribe
- Mute
- Subscribe to RSS Feed
- Permalink
- Report Inappropriate Content
I hope you are expecting it....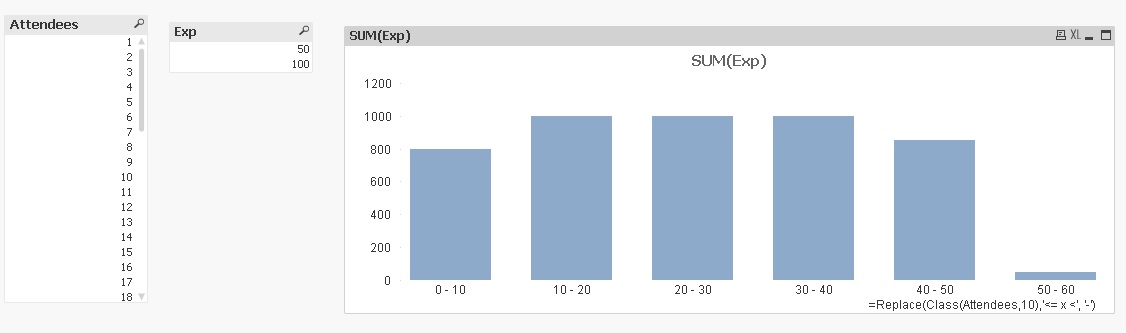
- Mark as New
- Bookmark
- Subscribe
- Mute
- Subscribe to RSS Feed
- Permalink
- Report Inappropriate Content
Not exactly
Like below
10-20
20-30
30-50
>50
Thanks for the immediate reply
- Mark as New
- Bookmark
- Subscribe
- Mute
- Subscribe to RSS Feed
- Permalink
- Report Inappropriate Content
change the calculated dimension like this
Replace(Class(Attendees,10),'<= x <', '-')
you will get exact result
and plz close this thread by marking as correct answer
thanks
Arul
- Mark as New
- Bookmark
- Subscribe
- Mute
- Subscribe to RSS Feed
- Permalink
- Report Inappropriate Content
Hi,
You can create the calculated dimension also
LOAD Attendees,
Expenses,
if(Attendees>=0 and Attendees<=10,'0-10',
if(Attendees>10 and Attendees<20,'10-20',
if(Attendees>20 and Attendees<30,'20-30',
if(Attendees>30 and Attendees<40,'30-40',
if(Attendees>40 and Attendees<50,'40-50',
if(Attendees>50 and Attendees<60,'50-60',
if(Attendees>60 and Attendees<70,'60-70',
if(Attendees>70 and Attendees<80,'70-80',
if(Attendees>80 and Attendees<90,'80-90',
if(Attendees>90 and Attendees<100,'90-100',
if(Attendees>100 and Attendees<110,'100-110',
))))))))))) asDimAttendees
FROM
[Range_Sample Data.xlsx]
(ooxml, embedded labels, table is Sheet1);
Regards
Anand
- Mark as New
- Bookmark
- Subscribe
- Mute
- Subscribe to RSS Feed
- Permalink
- Report Inappropriate Content
find the attachment
plz close the thread
- Mark as New
- Bookmark
- Subscribe
- Mute
- Subscribe to RSS Feed
- Permalink
- Report Inappropriate Content
you can do that in your script using if conditions or interval match.
and you can do that from your chart using the class() function.
- Mark as New
- Bookmark
- Subscribe
- Mute
- Subscribe to RSS Feed
- Permalink
- Report Inappropriate Content
Hello Arul,
Thanks for the response,
But i need to show in below order also
10-20
20-30
30-50
>50
can you please check the above values, it is not in the sequence. Please check the attached excel chart for the expected value
Thanks
- Mark as New
- Bookmark
- Subscribe
- Mute
- Subscribe to RSS Feed
- Permalink
- Report Inappropriate Content
like this