Unlock a world of possibilities! Login now and discover the exclusive benefits awaiting you.
- Qlik Community
- :
- All Forums
- :
- QlikView App Dev
- :
- How to create yearly sales given the quarterly num...
- Subscribe to RSS Feed
- Mark Topic as New
- Mark Topic as Read
- Float this Topic for Current User
- Bookmark
- Subscribe
- Mute
- Printer Friendly Page
- Mark as New
- Bookmark
- Subscribe
- Mute
- Subscribe to RSS Feed
- Permalink
- Report Inappropriate Content
How to create yearly sales given the quarterly numbers
Hi,
Have a below scenario. I have quarterly sales numbers and and want to get yearly sales as well in the summary table.
I am not allowed to create a column for the year as I am using some functions - Pick , Dim to get the Qtr with Previous Qtr, Quarter with the same Quarter of previous Year comparisons.
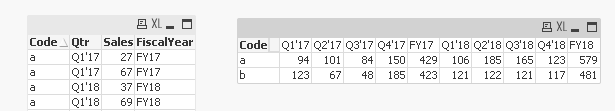
Base Data :
| Code | Qtr | sales |
| a | Q1'18 | 37 |
| b | Q1'18 | 76 |
| a | Q2'18 | 99 |
| b | Q2'18 | 33 |
| a | Q3'18 | 79 |
| b | Q3'18 | 42 |
| a | Q4'18 | 85 |
| b | Q4'18 | 82 |
| a | Q1'17 | 27 |
| b | Q1'17 | 67 |
| a | Q2'17 | 48 |
| b | Q2'17 | 56 |
| a | Q3'17 | 21 |
| b | Q3'17 | 26 |
| a | Q4'17 | 69 |
| b | Q4'17 | 85 |
| a | Q1'18 | 69 |
| b | Q1'18 | 45 |
| a | Q2'18 | 86 |
| b | Q2'18 | 89 |
| a | Q3'18 | 86 |
| b | Q3'18 | 79 |
| a | Q4'18 | 38 |
| b | Q4'18 | 35 |
| a | Q1'17 | 67 |
| b | Q1'17 | 56 |
| a | Q2'17 | 53 |
| b | Q2'17 | 11 |
| a | Q3'17 | 63 |
| b | Q3'17 | 22 |
| a | Q4'17 | 81 |
| b | Q4'17 | 100 |
Expected table:
| Code | Q1'17 | Q2'17 | Q3'17 | Q4'17 | FY17 | Q1'18 | Q2'18 | Q3'18 | Q4'18 | FY18 |
| a | 94 | 101 | 84 | 150 | 429 | 106 | 185 | 165 | 123 | 579 |
| b | 123 | 67 | 48 | 185 | 423 | 121 | 122 | 121 | 117 | 481 |
- « Previous Replies
-
- 1
- 2
- Next Replies »
Accepted Solutions
- Mark as New
- Bookmark
- Subscribe
- Mute
- Subscribe to RSS Feed
- Permalink
- Report Inappropriate Content
Script
Data:
LOAD *,
'FY' & Right(Qtr, 2) as FiscalYear;
LOAD * INLINE [
Code, Qtr, sales
a, "Q1'18", 37
b, "Q1'18", 76
a, "Q2'18", 99
b, "Q2'18", 33
a, "Q3'18", 79
b, "Q3'18", 42
a, "Q4'18", 85
b, "Q4'18", 82
a, "Q1'17", 27
b, "Q1'17", 67
a, "Q2'17", 48
b, "Q2'17", 56
a, "Q3'17", 21
b, "Q3'17", 26
a, "Q4'17", 69
b, "Q4'17", 85
a, "Q1'18", 69
b, "Q1'18", 45
a, "Q2'18", 86
b, "Q2'18", 89
a, "Q3'18", 86
b, "Q3'18", 79
a, "Q4'18", 38
b, "Q4'18", 35
a, "Q1'17", 67
b, "Q1'17", 56
a, "Q2'17", 53
b, "Q2'17", 11
a, "Q3'17", 63
b, "Q3'17", 22
a, "Q4'17", 81
b, "Q4'17", 100
];
Dim:
LOAD * INLINE [
Dim
1
2
];
Chart Dimensions
Code
=Pick(Dim, Qtr, FiscalYear)
Expression
Sum(sales)
Sort the second dimension using
=RangeAvg(Right(FiscalYear, 2), Right(Qtr, 2)) + Only({1} Dim)/1E10
- Mark as New
- Bookmark
- Subscribe
- Mute
- Subscribe to RSS Feed
- Permalink
- Report Inappropriate Content
Hi Satya,
Not really understand what is the restriction you having to get the year out.
Attached is the qvw with the expected result.
Thanks and regards,
Arthur Fong
- Mark as New
- Bookmark
- Subscribe
- Mute
- Subscribe to RSS Feed
- Permalink
- Report Inappropriate Content
| Code | Q1'17 | Q2'17 | Q3'17 | Q4'17 | FY17 | Q1'18 | Q2'18 | Q3'18 | Q4'18 | FY18 | Q1 Y/Y | Q2 Y/Y | Q3 Y/Y | Q4 Y/Y | FY |
|---|---|---|---|---|---|---|---|---|---|---|---|---|---|---|---|
| a | 94 | 101 | 84 | 150 | 429 | 106 | 185 | 165 | 123 | 579 | 13% | 83% | 96% | -18% | 35% |
| b | 123 | 67 | 48 | 185 | 423 | 121 | 122 | 121 | 117 | 481 | -2% | 82% | 152% | -37% | 14% |
Quarterly change = (Q1'8 - Q1'17) / Q1'17
Used Pick and Dim Functions to plot the entire table.
- Mark as New
- Bookmark
- Subscribe
- Mute
- Subscribe to RSS Feed
- Permalink
- Report Inappropriate Content
One option is as attached and hope this helps.
- Mark as New
- Bookmark
- Subscribe
- Mute
- Subscribe to RSS Feed
- Permalink
- Report Inappropriate Content
Script
Data:
LOAD *,
'FY' & Right(Qtr, 2) as FiscalYear;
LOAD * INLINE [
Code, Qtr, sales
a, "Q1'18", 37
b, "Q1'18", 76
a, "Q2'18", 99
b, "Q2'18", 33
a, "Q3'18", 79
b, "Q3'18", 42
a, "Q4'18", 85
b, "Q4'18", 82
a, "Q1'17", 27
b, "Q1'17", 67
a, "Q2'17", 48
b, "Q2'17", 56
a, "Q3'17", 21
b, "Q3'17", 26
a, "Q4'17", 69
b, "Q4'17", 85
a, "Q1'18", 69
b, "Q1'18", 45
a, "Q2'18", 86
b, "Q2'18", 89
a, "Q3'18", 86
b, "Q3'18", 79
a, "Q4'18", 38
b, "Q4'18", 35
a, "Q1'17", 67
b, "Q1'17", 56
a, "Q2'17", 53
b, "Q2'17", 11
a, "Q3'17", 63
b, "Q3'17", 22
a, "Q4'17", 81
b, "Q4'17", 100
];
Dim:
LOAD * INLINE [
Dim
1
2
];
Chart Dimensions
Code
=Pick(Dim, Qtr, FiscalYear)
Expression
Sum(sales)
Sort the second dimension using
=RangeAvg(Right(FiscalYear, 2), Right(Qtr, 2)) + Only({1} Dim)/1E10
- Mark as New
- Bookmark
- Subscribe
- Mute
- Subscribe to RSS Feed
- Permalink
- Report Inappropriate Content
Hi Sunny,
Unable to break the code "=RangeAvg(Right(FiscalYear, 2), Right(Qtr, 2)) + Only({1} Dim)/1E10" that you used for sorting.. what is the significance of 1E10?
If I have 3 dimensions (=Pick(Dim, Qtr, FiscalYear,XYZ) ) how to use SORT expression that you suggested
sorry for many questions, but want to break the sort expression that you suggested.
- Mark as New
- Bookmark
- Subscribe
- Mute
- Subscribe to RSS Feed
- Permalink
- Report Inappropriate Content
what is the significance of 1E10?
1E10 is another way of writing 10000000000. and it is used to give a lower sorting weight to Dim compared to the first part which used FiscalYear and Qtr.
If I have 3 dimensions (=Pick(Dim, Qtr, FiscalYear,XYZ) ) how to use SORT expression that you suggested
I have no idea how you want to sort it. May be if you share an example file, I might be able to give suggestions 
- Mark as New
- Bookmark
- Subscribe
- Mute
- Subscribe to RSS Feed
- Permalink
- Report Inappropriate Content
I have 4 dimensions "
=Pick(Dim, Fiscal_Quarter,Fiscal_Year, Quarter&' y/y Diff', Quarter&' y/y %Change') "
Dimensions:
Fiscal_Quarter : FY12Q1, FY12Q2, FY12Q3....
Fiscal_Year : FY12, FY13, FY14...
Quarter (Q1, Q2, Q3, Q4) y/y Diff : Calculating the Difference of sales compared to previous Year same Quarter (Ex: FY13Q1-FY12Q1)
4th Dimension is Quarterly change Percentage : Fy13Q1/FY12Q1 -1
I am using
Expression : " RangeSum(Only({1} Dim), FYearMonth/1e10) "
Text : A-Z
I am getting Fiscal Year after Fiscal Quarter columns (8 Columns for Qtrs and then 2 columns for Fiscal Years)
How to customize the sequence Ex: FY12Q1, FY12Q2, FY12Q3, FY12Q4, FY12, FY13Q1,FY13Q2,FY13Q3,FY13Q4,FY13, Qtr Diff.....
Hope my explanation is clear..

- Mark as New
- Bookmark
- Subscribe
- Mute
- Subscribe to RSS Feed
- Permalink
- Report Inappropriate Content
May be move Fiscal Year ahead of Fiscal Quarter in your dimension
=Pick(Dim, Fiscal_Year, Fiscal_Quarter, Quarter&' y/y Diff', Quarter&' y/y %Change')
and make the expression change accordingly.
- Mark as New
- Bookmark
- Subscribe
- Mute
- Subscribe to RSS Feed
- Permalink
- Report Inappropriate Content
Thank you Sunny,
I changed the sequence in Dimensions as you advised..still I could not the sequence that am looking for

Here is what I am looking for..
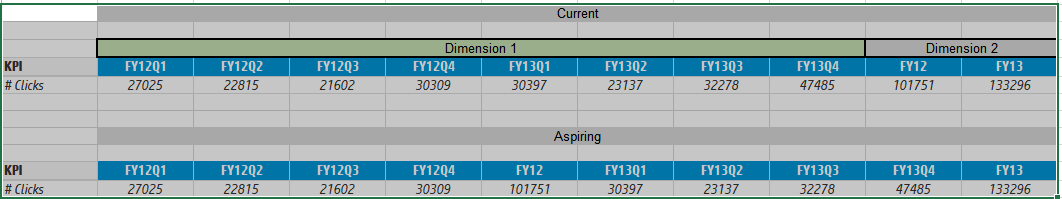
I am unable to fit RangeAvg function (which you advised in the thread ) for the sorting
your suggestion =RangeAvg(Right(FiscalYear, 2), Right(Qtr, 2)) + Only({1} Dim)/1E10
my current expression = RangeSum(Only({1} Dim), FYearMonth/1e10)
How to proceed...
- « Previous Replies
-
- 1
- 2
- Next Replies »