Unlock a world of possibilities! Login now and discover the exclusive benefits awaiting you.
- Qlik Community
- :
- All Forums
- :
- QlikView App Dev
- :
- Re: How to display 2 years of data when one is sel...
Options
- Subscribe to RSS Feed
- Mark Topic as New
- Mark Topic as Read
- Float this Topic for Current User
- Bookmark
- Subscribe
- Mute
- Printer Friendly Page
Turn on suggestions
Auto-suggest helps you quickly narrow down your search results by suggesting possible matches as you type.
Showing results for
Creator III
2015-11-21
12:50 AM
- Mark as New
- Bookmark
- Subscribe
- Mute
- Subscribe to RSS Feed
- Permalink
- Report Inappropriate Content
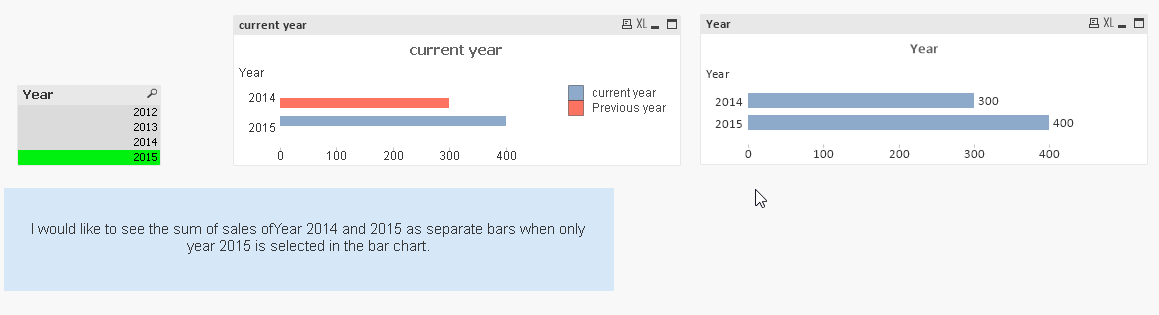
How to display 2 years of data when one is selected in list box
How do I show my year sales as bar chart as in the below example on left in a bar chart when I have only 1 year selected.
qvw file attached.

- Tags:
- new_to_qlikview
871 Views
1 Solution
Accepted Solutions
Master III
2015-11-21
12:59 AM
- Mark as New
- Bookmark
- Subscribe
- Mute
- Subscribe to RSS Feed
- Permalink
- Report Inappropriate Content
check this
721 Views
5 Replies
Master III
2015-11-21
12:59 AM
- Mark as New
- Bookmark
- Subscribe
- Mute
- Subscribe to RSS Feed
- Permalink
- Report Inappropriate Content
check this
722 Views
Partner - Specialist II
2015-11-21
01:22 AM
- Mark as New
- Bookmark
- Subscribe
- Mute
- Subscribe to RSS Feed
- Permalink
- Report Inappropriate Content
Hi use this expression:
sum( {<Year={'2014','2015'}>}Sales)
Regards,
Nagarjuna
721 Views
Partner - Creator III
2015-11-21
01:35 AM
- Mark as New
- Bookmark
- Subscribe
- Mute
- Subscribe to RSS Feed
- Permalink
- Report Inappropriate Content
Hi Gerry,
Use the following expression
Sum({$<Year={">=$(Max(Year)-2)<=$(Max(Year))"}>}Sales)
VJ
Creator III
2015-11-21
01:51 AM
Author
- Mark as New
- Bookmark
- Subscribe
- Mute
- Subscribe to RSS Feed
- Permalink
- Report Inappropriate Content
perfect !
721 Views
Master II
2015-11-21
07:24 AM
- Mark as New
- Bookmark
- Subscribe
- Mute
- Subscribe to RSS Feed
- Permalink
- Report Inappropriate Content
Two solutions
721 Views