Unlock a world of possibilities! Login now and discover the exclusive benefits awaiting you.
- Qlik Community
- :
- All Forums
- :
- QlikView App Dev
- :
- Re: How to display ALL values on a stacked bar cha...
- Subscribe to RSS Feed
- Mark Topic as New
- Mark Topic as Read
- Float this Topic for Current User
- Bookmark
- Subscribe
- Mute
- Printer Friendly Page
- Mark as New
- Bookmark
- Subscribe
- Mute
- Subscribe to RSS Feed
- Permalink
- Report Inappropriate Content
How to display ALL values on a stacked bar chart
Hi,
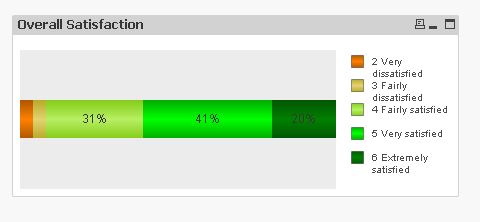
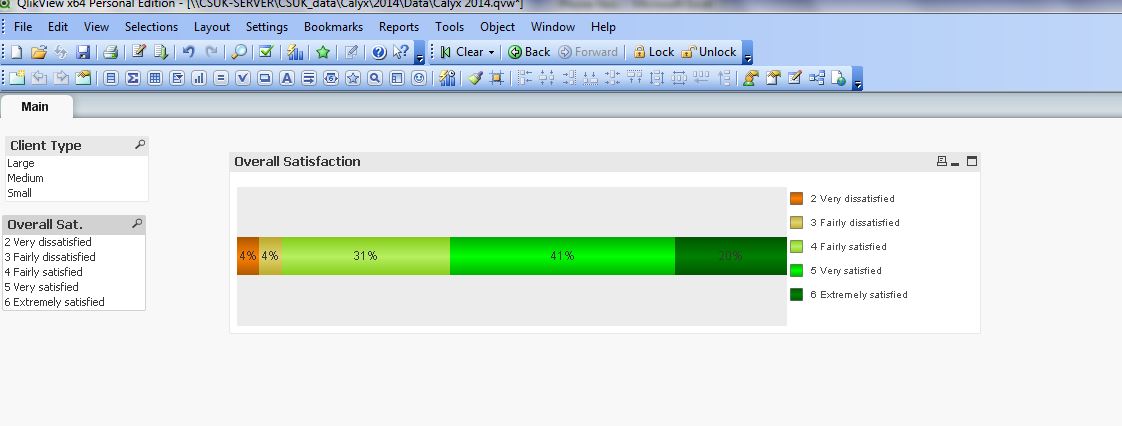
I have a stacked bar chart which is just as I want it EXCEPT it doesn't display values on the chart that are less than 10%
I'd like to remove this limit and display all the values

Any ideas?
Thanks
- Mark as New
- Bookmark
- Subscribe
- Mute
- Subscribe to RSS Feed
- Permalink
- Report Inappropriate Content
There isn't enough space to display values, try to increase the lenght of the object ...
- Mark as New
- Bookmark
- Subscribe
- Mute
- Subscribe to RSS Feed
- Permalink
- Report Inappropriate Content
Thanks Alessandro,
This works but makes the actual chart ridiculously long just to accommodate the figures!

Is there a way of displaying the figures without having a chart that takes up the whole width of the screen?
Perhaps some way of off-setting the display so that the numbers show above the chart segment?
Thanks
- Mark as New
- Bookmark
- Subscribe
- Mute
- Subscribe to RSS Feed
- Permalink
- Report Inappropriate Content
remove legend to adjust the bar,and I dont think there is any other way to show the values segment wise other than the inside the segment..
- Mark as New
- Bookmark
- Subscribe
- Mute
- Subscribe to RSS Feed
- Permalink
- Report Inappropriate Content
Maeby you could try moving the legend above the bars (since your chart grows in horizontal) If this is not enough, I would go for creating an additional object (Straight table probably) working as the chart legend.
- Mark as New
- Bookmark
- Subscribe
- Mute
- Subscribe to RSS Feed
- Permalink
- Report Inappropriate Content
Remove the % sign will make the text slightly smaller but does not get around the fact that the bar must be wider than the text being displayed inside it. The values on the small bars will be shown as a pop-up when the user hovers over the small segments.
Otherwise you could display the bar and a straight table alongside.
- Mark as New
- Bookmark
- Subscribe
- Mute
- Subscribe to RSS Feed
- Permalink
- Report Inappropriate Content
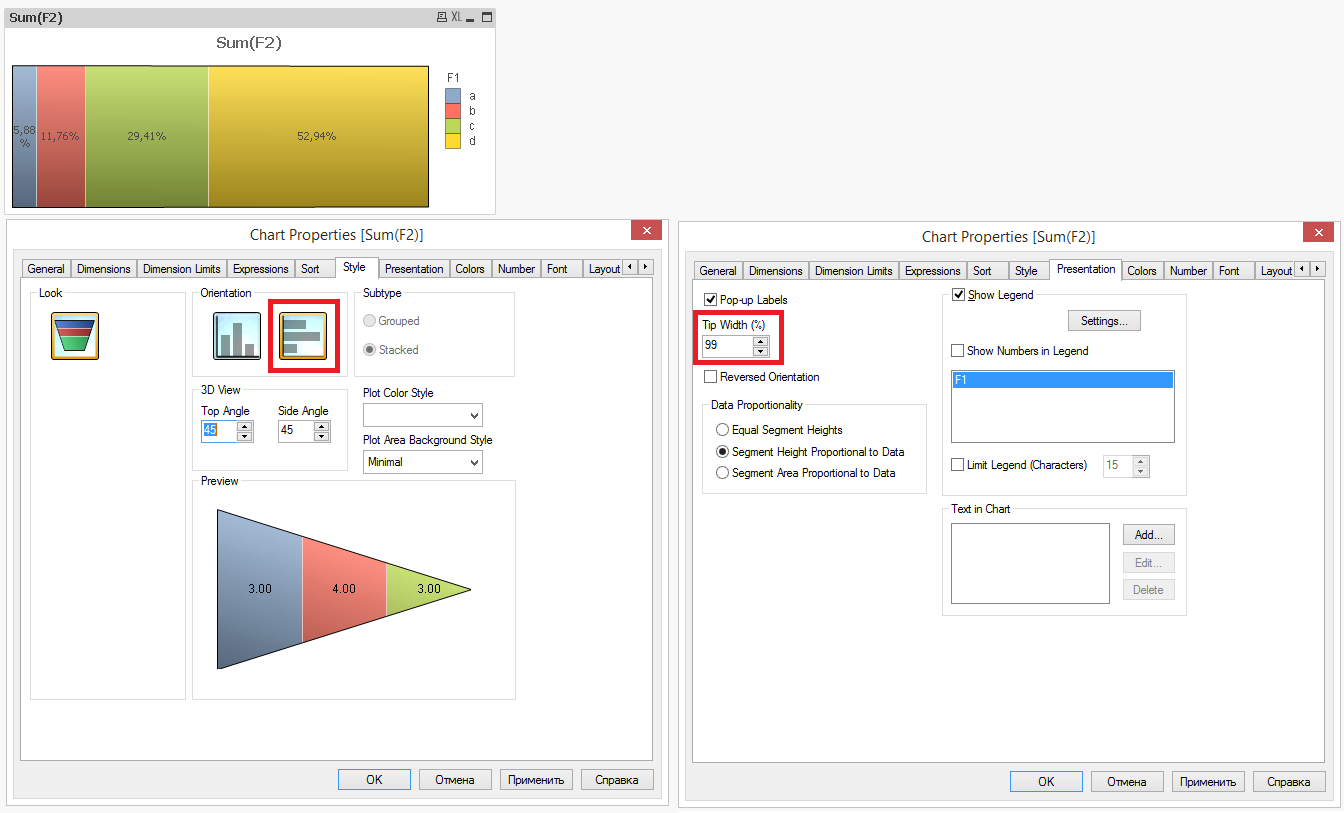
Just use another chart type, like Funnel.
It will show values anyway.
See pic:

- Mark as New
- Bookmark
- Subscribe
- Mute
- Subscribe to RSS Feed
- Permalink
- Report Inappropriate Content
Concatenating the value to the legend isn't an option?
- Mark as New
- Bookmark
- Subscribe
- Mute
- Subscribe to RSS Feed
- Permalink
- Report Inappropriate Content
Hello,
Did you figure it out how to achieve it?