Unlock a world of possibilities! Login now and discover the exclusive benefits awaiting you.
- Qlik Community
- :
- All Forums
- :
- QlikView App Dev
- :
- Re: How to display Comment as Text Data Only ?
- Subscribe to RSS Feed
- Mark Topic as New
- Mark Topic as Read
- Float this Topic for Current User
- Bookmark
- Subscribe
- Mute
- Printer Friendly Page
- Mark as New
- Bookmark
- Subscribe
- Mute
- Subscribe to RSS Feed
- Permalink
- Report Inappropriate Content
How to display Comment as Text Data Only ?
Hi All,
I have this set of data in my Qlikview:
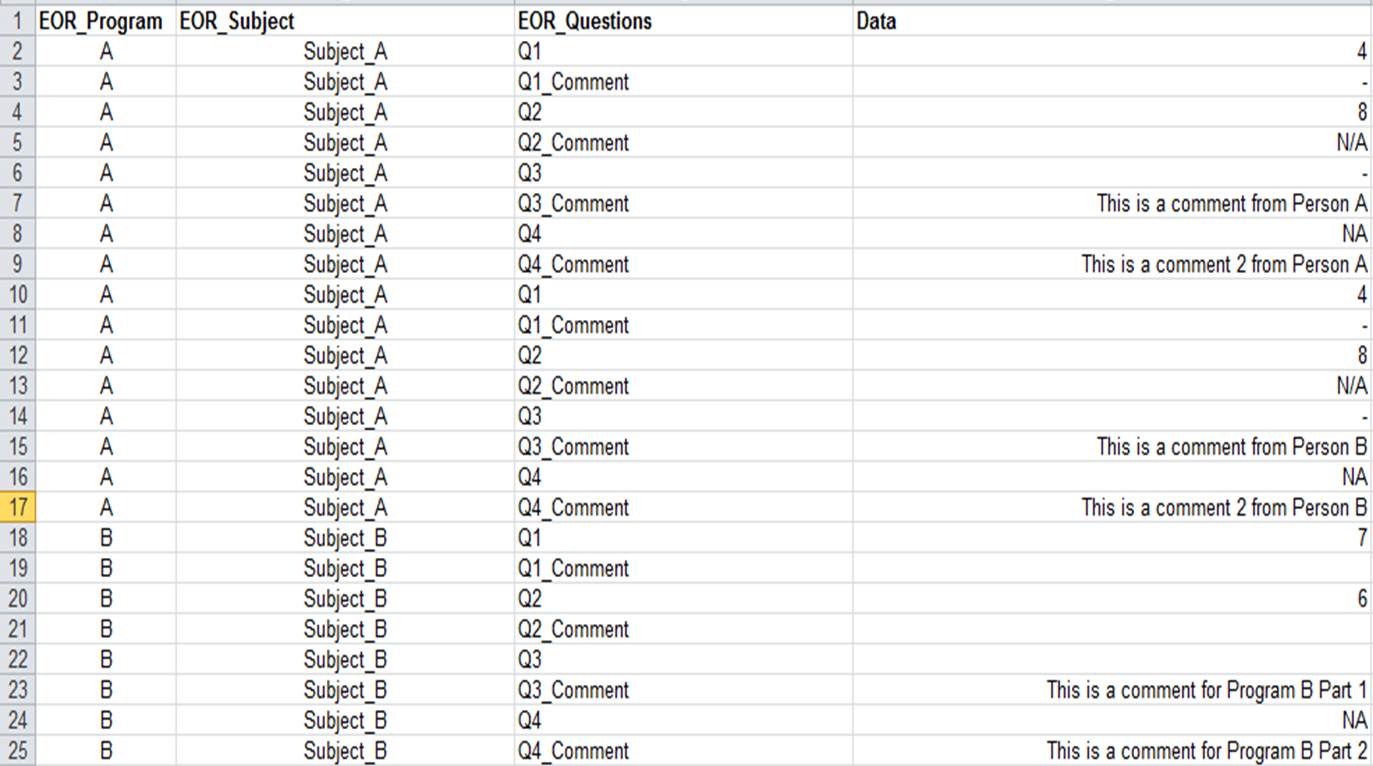
I only want to display Q3_Comment, Q4_Comment Group by EOR_Subject, EOR_Questions.
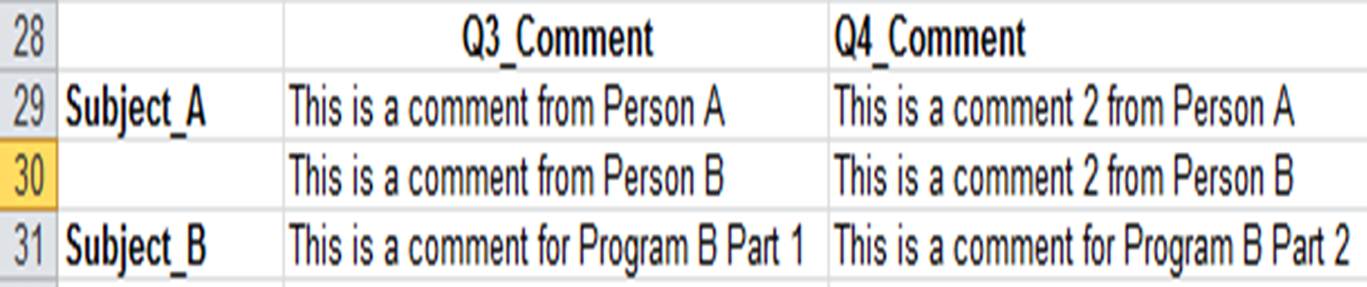
Result that I desired:
Questions:
1) What charts should i use for text only data ? I tried Straight table and pivot table but to no valid.
2) How to show only specific questions only group by Subject and sorted by questions. It seems that Pivot table should do the job but I am stuck at the expression part as there is no measure to be used as Data is text only.
3) How to omit the Q3_Comment, Q4_Comment that has NA, -, N/A, empty all at once ?
Thanks in advance.
Accepted Solutions
- Mark as New
- Bookmark
- Subscribe
- Mute
- Subscribe to RSS Feed
- Permalink
- Report Inappropriate Content
Use an expression like the below:
IF(WildMatch(EOR_Questions,'Q3_Comment','Q4_Comment')>0,'')
in your pivot. Keep the header of ur Expression as a single space value and it will do the thing.
Thanks
- Mark as New
- Bookmark
- Subscribe
- Mute
- Subscribe to RSS Feed
- Permalink
- Report Inappropriate Content
By far the easiest way is to add a listbox for the EOR_Questions field and then select in that listbox only those values you want to see the results for.
If you only want to show text values you can try an expression like: if(isnum(Data),null(),Data)
If you want to omit some values too you can try: if(isnum(Data) or match(Data, 'NA','N/A','-'),null(),Data)
talk is cheap, supply exceeds demand
- Mark as New
- Bookmark
- Subscribe
- Mute
- Subscribe to RSS Feed
- Permalink
- Report Inappropriate Content
Hi All,
Thanks for your help, manage to get this done with WildMatch expression. Below is the answer to it.
=If(WildMatch(EOR_Questions,'*27*','*28*','*29*')>0 ,EOR_Questions)
Warmest Rdgs,
Chun Wey