Unlock a world of possibilities! Login now and discover the exclusive benefits awaiting you.
- Qlik Community
- :
- All Forums
- :
- QlikView App Dev
- :
- Re: How to display a baseline and static reference...
- Subscribe to RSS Feed
- Mark Topic as New
- Mark Topic as Read
- Float this Topic for Current User
- Bookmark
- Subscribe
- Mute
- Printer Friendly Page
- Mark as New
- Bookmark
- Subscribe
- Mute
- Subscribe to RSS Feed
- Permalink
- Report Inappropriate Content
How to display a baseline and static reference bar(s) as part of data?
I have data in the form:
date, value
I create a bar chart with a dimension of weekstart(date) and expression of count(value).
What I need to do is display another bar on the left, for which the dimension label is "baseline" and for which there is a static number I have loaded in an inline table.
So the data would be:
baseline: 25
4/3/16: 24
4/10: 25
4/17: 26
The goal is to display 4 bars, not the 3 I would get from the "normal" data alone. And there is also another bar I would like to display that is "70% of baseline". So ultimately, I'd have 5 bars.
Accepted Solutions
- Mark as New
- Bookmark
- Subscribe
- Mute
- Subscribe to RSS Feed
- Permalink
- Report Inappropriate Content
- Mark as New
- Bookmark
- Subscribe
- Mute
- Subscribe to RSS Feed
- Permalink
- Report Inappropriate Content
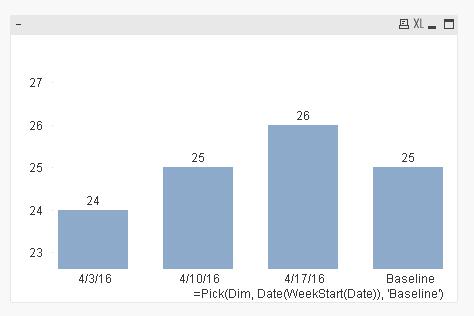
Like this?
Script:
Table:
LOAD * Inline [
Date, Value
4/3/16, 24
4/10/16, 25
4/17/16, 26
];
BaseLine:
LOAD * Inline [
BaseLine
25
];
Dim:
LOAD * Inline [
Dim
1
2
];
Bar Chart with
Dimension
=Pick(Dim, Date(WeekStart(Date)), 'Baseline')
Expression:
=Pick(Dim, Sum(Value), Sum(BaseLine))
- Mark as New
- Bookmark
- Subscribe
- Mute
- Subscribe to RSS Feed
- Permalink
- Report Inappropriate Content
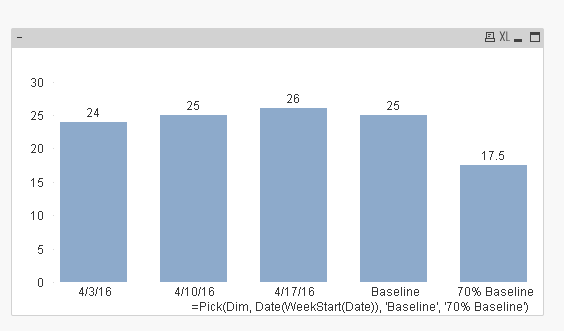
Updated view (Sorry missed the 70% of baseline bar earlier)
- Mark as New
- Bookmark
- Subscribe
- Mute
- Subscribe to RSS Feed
- Permalink
- Report Inappropriate Content
very helpful! I have now the need to include a "running average" bar; previously I did this using the totals feature, but now that does not work. I think I can use this =pick() function to throw a set analysis function in there...
- Mark as New
- Bookmark
- Subscribe
- Mute
- Subscribe to RSS Feed
- Permalink
- Report Inappropriate Content
What would the running average bar show? I mean the number?
- Mark as New
- Bookmark
- Subscribe
- Mute
- Subscribe to RSS Feed
- Permalink
- Report Inappropriate Content
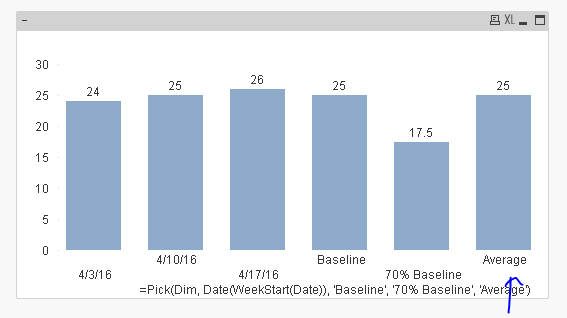
The running average would show the monthly average. So my chart has 7 vertical bars:
baseline
baseline * .70
week 1
week 2
week 3
week 4
4-week average
- Mark as New
- Bookmark
- Subscribe
- Mute
- Subscribe to RSS Feed
- Permalink
- Report Inappropriate Content
So if you have 2 months of data, you would see 2 bars? or I am having trouble picturing how it would work?
- Mark as New
- Bookmark
- Subscribe
- Mute
- Subscribe to RSS Feed
- Permalink
- Report Inappropriate Content
no, the one bar would be the average of the 4 weeks. If there were 5 weeks of data, there would be 5 weekly bars plus one bar of the average of those 5 weeks in addition to the 2 baseline/baseline*.7 bars
- Mark as New
- Bookmark
- Subscribe
- Mute
- Subscribe to RSS Feed
- Permalink
- Report Inappropriate Content
Something like this?