Unlock a world of possibilities! Login now and discover the exclusive benefits awaiting you.
- Qlik Community
- :
- All Forums
- :
- QlikView App Dev
- :
- Re: How to display cross tabular data in straight ...
- Subscribe to RSS Feed
- Mark Topic as New
- Mark Topic as Read
- Float this Topic for Current User
- Bookmark
- Subscribe
- Mute
- Printer Friendly Page
- Mark as New
- Bookmark
- Subscribe
- Mute
- Subscribe to RSS Feed
- Permalink
- Report Inappropriate Content
How to display cross tabular data in straight table ?
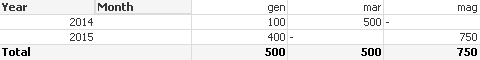
Hi, i want to display the data in cross tabular format in straight table.For reference see the attachment.
- Tags:
- new_to_qlikview
- Mark as New
- Bookmark
- Subscribe
- Mute
- Subscribe to RSS Feed
- Permalink
- Report Inappropriate Content
How about using a Pivot Table with the Always Fully Expanded option ticked to it looks like a Straight Table
- Mark as New
- Bookmark
- Subscribe
- Mute
- Subscribe to RSS Feed
- Permalink
- Report Inappropriate Content
you Need to define 12 expressions (for each month one and use set Analysis in each Expression)
sum({<Month={'Jan'}>}Sales
and so forth
I would do this Job only if customer really Needs it and Pivot table is not possible or allowed
- Mark as New
- Bookmark
- Subscribe
- Mute
- Subscribe to RSS Feed
- Permalink
- Report Inappropriate Content
Hi!
Why you dont want use a pivot like this?
Regards.
- Mark as New
- Bookmark
- Subscribe
- Mute
- Subscribe to RSS Feed
- Permalink
- Report Inappropriate Content
You just specify how we do above scenario in pivot?
- Mark as New
- Bookmark
- Subscribe
- Mute
- Subscribe to RSS Feed
- Permalink
- Report Inappropriate Content
As I do in the file that you can find in my post you do this:
- create a pivot table ad insert Year and Month in dimension, sum(sales) in expression,
- drag and drop Month from column to row;

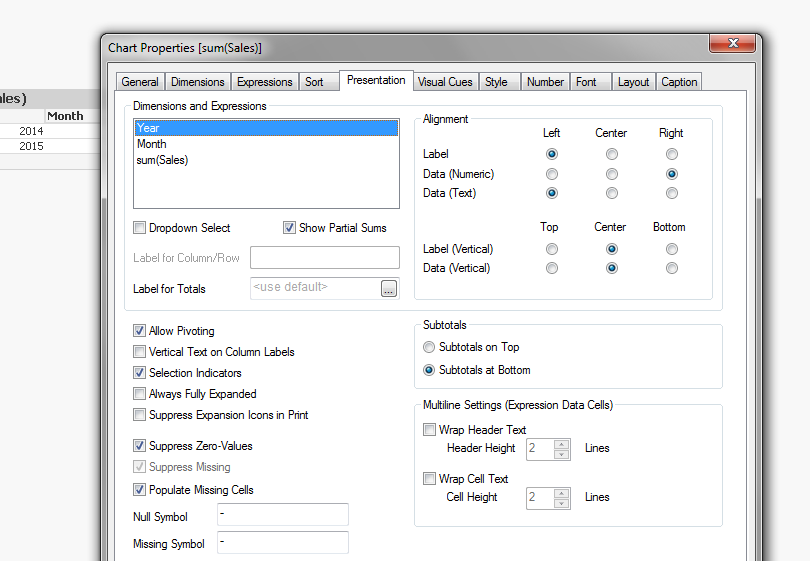
- in the presentation tab of the pivot table select Year (NOT Month) dimension and tyck Show Partial Total:
- Mark as New
- Bookmark
- Subscribe
- Mute
- Subscribe to RSS Feed
- Permalink
- Report Inappropriate Content
Thanks for Reply. Is their any way in straight tables except set expressions.
- Mark as New
- Bookmark
- Subscribe
- Mute
- Subscribe to RSS Feed
- Permalink
- Report Inappropriate Content
I think that you should use set expression in the straight table.