Unlock a world of possibilities! Login now and discover the exclusive benefits awaiting you.
- Qlik Community
- :
- All Forums
- :
- QlikView App Dev
- :
- Re: How to display the chart data in a separate co...
- Subscribe to RSS Feed
- Mark Topic as New
- Mark Topic as Read
- Float this Topic for Current User
- Bookmark
- Subscribe
- Mute
- Printer Friendly Page
- Mark as New
- Bookmark
- Subscribe
- Mute
- Subscribe to RSS Feed
- Permalink
- Report Inappropriate Content
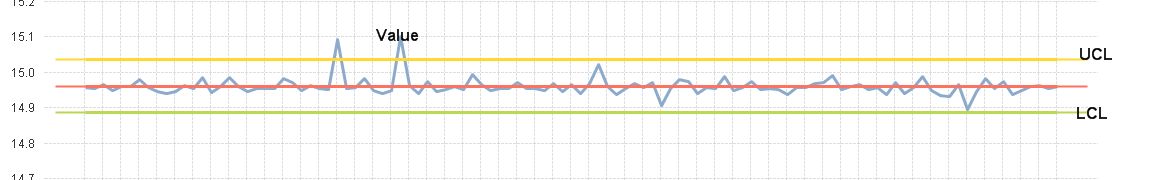
How to display the chart data in a separate color based on the LCL,UCl values?
Hi All,
I am plotting the chart with
Dimensions:
Lens,CloverUnit
Expressions:
1.=Sum( {$<[Clover Unit]={'A06129'}, Lens#={'1'},measure={'Ave Lens Diameter (mm)'}>}value)
2.=Sum( {$<[Clover Unit]={'A06129'}, Lens#={'1'},measure={'Ave Lens Diameter (mm)'}>}xbar)
3.=Sum( {$<[Clover Unit]={'A06129'}, Lens#={'1'},measure={'Ave Lens Diameter (mm)'}>}LCL)
4.=Sum( {$<[Clover Unit]={'A06129'}, Lens#={'1'},measure={'Ave Lens Diameter (mm)'}>}UCL)
But i just want to display the "Value" data in a seperate color(say "red") for >UCL and <LCL.
is it possible to do like that?
Please look at the attached image.
Thanks for any help.
Regards
Kumar
- Mark as New
- Bookmark
- Subscribe
- Mute
- Subscribe to RSS Feed
- Permalink
- Report Inappropriate Content
use background color for the expression
- Mark as New
- Bookmark
- Subscribe
- Mute
- Subscribe to RSS Feed
- Permalink
- Report Inappropriate Content
Hi,
Thanks for the reply.
I am getting color for that line.
But is it possible to show as a circle or some other thing behalf of that colored line.
Regards
Kumar
- Mark as New
- Bookmark
- Subscribe
- Mute
- Subscribe to RSS Feed
- Permalink
- Report Inappropriate Content
something like :
if(Sum( {$<[Clover Unit]={'A06129'}, Lens#={'1'},measure={'Ave Lens Diameter (mm)'}>}value) > Sum( {$<[Clover Unit]={'A06129'}, Lens#={'1'},measure={'Ave Lens Diameter (mm)'}>}UCL) , red(), blue())
in the background color dialog of the expression 'value'
- Mark as New
- Bookmark
- Subscribe
- Mute
- Subscribe to RSS Feed
- Permalink
- Report Inappropriate Content
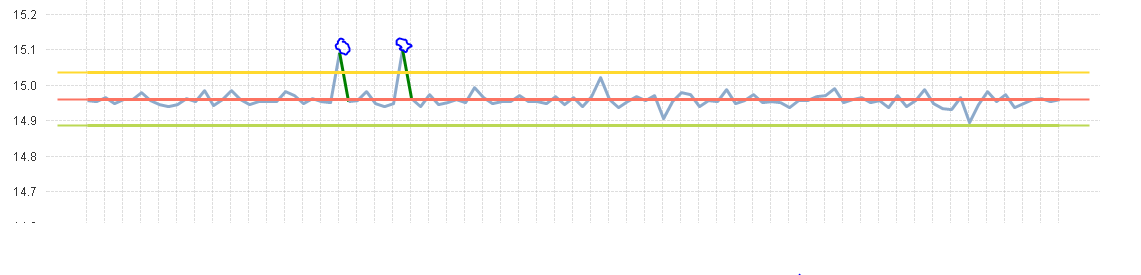
Hi loannis,
Ya it works and it is showing the diffarant color which is above UCL and below LCL.
But what i'm asking is
Can't we show the circles at the top of those curves?
please see the attached image.
Regards
Kumar
- Mark as New
- Bookmark
- Subscribe
- Mute
- Subscribe to RSS Feed
- Permalink
- Report Inappropriate Content
Hi Loannis,
Thanks for that.I am getting the color for value above UCL and below LCL.
already i told you in my last reply.
Now what i am asking is,
Can't we display a circle at the curves?
Please look at the attached image.

Regards
Kumar
- Mark as New
- Bookmark
- Subscribe
- Mute
- Subscribe to RSS Feed
- Permalink
- Report Inappropriate Content
Dont think it is possible, but I am not 100% sure.A workaround would be to use the "Show value dialog" for the expression and show only the value on the peaks, but I do not know if you want this. Maybe using a Reference Line could also be an option.