Unlock a world of possibilities! Login now and discover the exclusive benefits awaiting you.
- Qlik Community
- :
- All Forums
- :
- QlikView App Dev
- :
- Re: How to display the legend of a chart with mult...
- Subscribe to RSS Feed
- Mark Topic as New
- Mark Topic as Read
- Float this Topic for Current User
- Bookmark
- Subscribe
- Mute
- Printer Friendly Page
- Mark as New
- Bookmark
- Subscribe
- Mute
- Subscribe to RSS Feed
- Permalink
- Report Inappropriate Content
How to display the legend of a chart with multiple columns
![QlikView x64 Personal Edition - [CUsersPCANNISTRA00DesktopFRAUD QLIKProgetto FinaleIndicatori Antifrode V_0.05.qvw].png - Paint.jpg](/legacyfs/online/122171_QlikView x64 Personal Edition - [CUsersPCANNISTRA00DesktopFRAUD QLIKProgetto FinaleIndicatori Antifrode V_0.05.qvw].png - Paint.jpg)
- Mark as New
- Bookmark
- Subscribe
- Mute
- Subscribe to RSS Feed
- Permalink
- Report Inappropriate Content
Hi,
Click on the Show Legend in the Presentation tab of the chart properties.
Thanks,
Vk
- Mark as New
- Bookmark
- Subscribe
- Mute
- Subscribe to RSS Feed
- Permalink
- Report Inappropriate Content
Hi Vk,
I would like to see all the results of the legend (which I darkened for privacy ) across multiple columns to see all of them and not having to click the page down
- Mark as New
- Bookmark
- Subscribe
- Mute
- Subscribe to RSS Feed
- Permalink
- Report Inappropriate Content
Does it need to be a pie chart? A bar chart would make it much easier to match the legends to the values since they'd line right up. It's also easier to compare bar lengths than to compare slice areas. Doesn't solve the scrolling problem unless they all fit, though. It's interactive, though, so you could use an "others" bar, and click through it to get the smaller values. Just a thought since I don't know how to do what you're asking in any simple way.
- Mark as New
- Bookmark
- Subscribe
- Mute
- Subscribe to RSS Feed
- Permalink
- Report Inappropriate Content
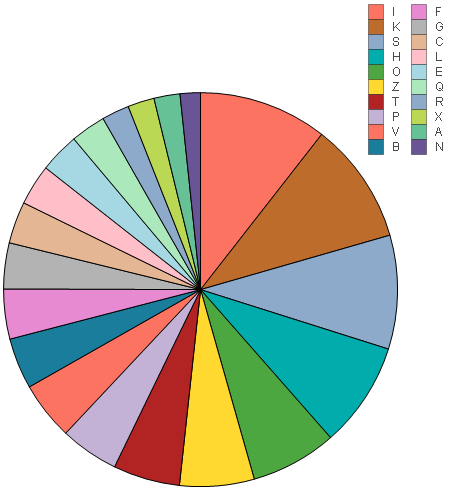
Hi John, thanks for the reply.changing graph is correct maybe I ask to obtain a legend on multiple columns,
like that :
![QlikView x64 Personal Edition - [CUsersPCANNISTRA00DesktopFRAUD QLIKProgetto FinaleIndicatori Antifrode V_0.05.qvw]_2.png - Paint.jpg](/legacyfs/online/122247_QlikView x64 Personal Edition - [CUsersPCANNISTRA00DesktopFRAUD QLIKProgetto FinaleIndicatori Antifrode V_0.05.qvw]_2.png - Paint.jpg)
- Mark as New
- Bookmark
- Subscribe
- Mute
- Subscribe to RSS Feed
- Permalink
- Report Inappropriate Content
It does seem like QlikView should be able to do that, but I couldn't figure it out. So I faked it. This is two charts made to look like one. The pie chart has no legend. Then there's a bar chart that has ONLY the legend. Stick them together, make sure they sort in the same order and have persistent colors, and I think it'll work.
- Mark as New
- Bookmark
- Subscribe
- Mute
- Subscribe to RSS Feed
- Permalink
- Report Inappropriate Content
Good Idea, thank you for the Example, nicework. 