Unlock a world of possibilities! Login now and discover the exclusive benefits awaiting you.
- Qlik Community
- :
- All Forums
- :
- QlikView App Dev
- :
- How to display top three most popular in QlikView?
- Subscribe to RSS Feed
- Mark Topic as New
- Mark Topic as Read
- Float this Topic for Current User
- Bookmark
- Subscribe
- Mute
- Printer Friendly Page
- Mark as New
- Bookmark
- Subscribe
- Mute
- Subscribe to RSS Feed
- Permalink
- Report Inappropriate Content
How to display top three most popular in QlikView?
Hello,
So I have a bunch of data; with different types of products with different kind of product defects.
What I would like to do is show the top 3 most common defects for each product type.
What would be the best way of showing this in QlikView?
Thanks.
- Tags:
- new_to_qlikview
- Mark as New
- Bookmark
- Subscribe
- Mute
- Subscribe to RSS Feed
- Permalink
- Report Inappropriate Content
Hi Kieron,
Check out this blog post, it describes exactly the problem that you are dealing with:
QlikView Blog Q-Tip #5 – Show Top Performers. Common but not too trivial. | Natural Synergies
Also, check out my new book QlikView Your Business. In the book, I'm describing this and many other advanced analytical solutions in QlikView and Qlik Sense.
cheers,
Oleg Troyansky
- Mark as New
- Bookmark
- Subscribe
- Mute
- Subscribe to RSS Feed
- Permalink
- Report Inappropriate Content
Kieron
Hard to say the best way without more detail of your detail etc.
However, dimension limits within a Chart sound like a good starting point as Oleg has said.
- Mark as New
- Bookmark
- Subscribe
- Mute
- Subscribe to RSS Feed
- Permalink
- Report Inappropriate Content
Richard - I wish Dimension Limits could be used there... Based on the requirement to show " the top 3 most common defects for each product type" it sounds like it's going to be a Pivot table with Product Type and Defect as the two dimensions. Dimension Limits are not going to help there, unfortunately (no Dimension limits for Pivot tables...)
cheers,
Oleg Troyansky
- Mark as New
- Bookmark
- Subscribe
- Mute
- Subscribe to RSS Feed
- Permalink
- Report Inappropriate Content
Hello Kieron,
If you could send us some sample information that would be easy to work on quickly.
However, using pivot you can try this:
Dimension: ProductType
Expression: = If(Aggr(Rank(Count(<DefectColName>),4), ProductType)<=3 , <DefectColname>)
I am not sure how it works at your end. If not just send use a sample qvw.
Thanks,
V.
- Mark as New
- Bookmark
- Subscribe
- Mute
- Subscribe to RSS Feed
- Permalink
- Report Inappropriate Content
Hi thanks all for your replies so far;
So I currently have the chart shown:
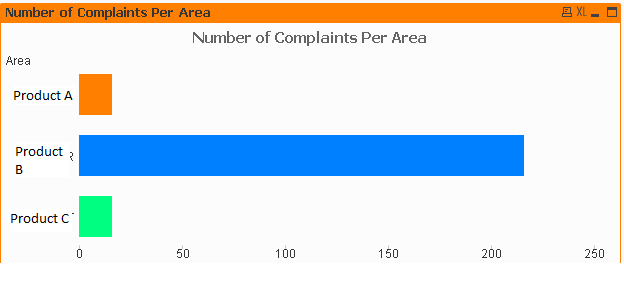
What I would like to do is so that if you click on product A it will show the top 3 complaints for product A. To give some background on my data; it is one big excel file with a new row for each complaint with the product type in one row and then a text description of the complaint in another. There can be many of each text complaint so i.e 10 "broken handles". So what I would like it to show the 3 most common text complaints for each product?
Hope that helps?
- Mark as New
- Bookmark
- Subscribe
- Mute
- Subscribe to RSS Feed
- Permalink
- Report Inappropriate Content
Sorry Add your DefectColumn as well in the Dimensions tab
So, it will be
Dimension: ProductType, DefectColName
Expression: = If(Aggr(Rank(Count(<DefectColName>),4), ProductType)<=3 , <DefectColname>)
V.