Unlock a world of possibilities! Login now and discover the exclusive benefits awaiting you.
- Qlik Community
- :
- All Forums
- :
- QlikView App Dev
- :
- Re: How to draw bubble and line in one chart?
- Subscribe to RSS Feed
- Mark Topic as New
- Mark Topic as Read
- Float this Topic for Current User
- Bookmark
- Subscribe
- Mute
- Printer Friendly Page
- Mark as New
- Bookmark
- Subscribe
- Mute
- Subscribe to RSS Feed
- Permalink
- Report Inappropriate Content
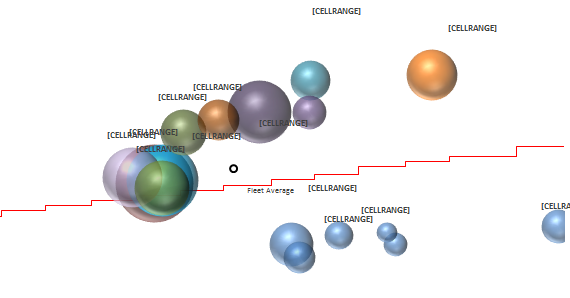
How to draw bubble and line in one chart?
Anyone know how to draw bubble and line in one chart?
Bubble means the products, radius means the volume.
The step chart is to show the score limit.
My colleague draw this chart in excel.
Now I need to achieve this chart in Qlik View.
- « Previous Replies
-
- 1
- 2
- Next Replies »
Accepted Solutions
- Mark as New
- Bookmark
- Subscribe
- Mute
- Subscribe to RSS Feed
- Permalink
- Report Inappropriate Content
Hello Cai,
As per design you can not have Scatter Chart(Bubble) and Line Chart in a single Chart. In Line Chart we define dimensions (X - Axis) and required measures (Y- Axis); whereas Scatter Chart demands expressions for for X, Y, & Z Axis.
As a workaround, you can create a line chart as well as scatter chart. Change the Transparency of scatter chart to 100% and Layer to Top and place it over to line chart.
Regards!
Rahul Pawar
- Mark as New
- Bookmark
- Subscribe
- Mute
- Subscribe to RSS Feed
- Permalink
- Report Inappropriate Content
Try with the Grid / Scatter chart option in QV the exact representation might not be possible but I will give you a close representation
- Mark as New
- Bookmark
- Subscribe
- Mute
- Subscribe to RSS Feed
- Permalink
- Report Inappropriate Content
Hello Cai,
As per design you can not have Scatter Chart(Bubble) and Line Chart in a single Chart. In Line Chart we define dimensions (X - Axis) and required measures (Y- Axis); whereas Scatter Chart demands expressions for for X, Y, & Z Axis.
As a workaround, you can create a line chart as well as scatter chart. Change the Transparency of scatter chart to 100% and Layer to Top and place it over to line chart.
Regards!
Rahul Pawar
- Mark as New
- Bookmark
- Subscribe
- Mute
- Subscribe to RSS Feed
- Permalink
- Report Inappropriate Content
Can the Grid show like the step chart???
- Mark as New
- Bookmark
- Subscribe
- Mute
- Subscribe to RSS Feed
- Permalink
- Report Inappropriate Content
Can I change the two chart at the same time? For example someone want to chose one area of the chart to see the details.
- Mark as New
- Bookmark
- Subscribe
- Mute
- Subscribe to RSS Feed
- Permalink
- Report Inappropriate Content
As said earlier, the chart which is using Top layer will be available to make selections; those selections will gets reflected to other chart objects (QlikView Associative Model). Adding more to it, if you make a filter selection from outside of the chart then both the charts will respond to that selection.
Regards!
Rahul Pawar
- Mark as New
- Bookmark
- Subscribe
- Mute
- Subscribe to RSS Feed
- Permalink
- Report Inappropriate Content
Thank you very much!!!
- Mark as New
- Bookmark
- Subscribe
- Mute
- Subscribe to RSS Feed
- Permalink
- Report Inappropriate Content
With this approach , you need to be really careful while placing the charts because once you make the selection the position of the line and bubbles may not be in sync and it would be hard to maintain .
- Mark as New
- Bookmark
- Subscribe
- Mute
- Subscribe to RSS Feed
- Permalink
- Report Inappropriate Content
How to restrict the axis of the two chart change synchronous??
- Mark as New
- Bookmark
- Subscribe
- Mute
- Subscribe to RSS Feed
- Permalink
- Report Inappropriate Content
Could you please elaborate more on this?
- « Previous Replies
-
- 1
- 2
- Next Replies »