Unlock a world of possibilities! Login now and discover the exclusive benefits awaiting you.
- Qlik Community
- :
- All Forums
- :
- QlikView App Dev
- :
- How to draw full lines in a full accumulation line...
- Subscribe to RSS Feed
- Mark Topic as New
- Mark Topic as Read
- Float this Topic for Current User
- Bookmark
- Subscribe
- Mute
- Printer Friendly Page
- Mark as New
- Bookmark
- Subscribe
- Mute
- Subscribe to RSS Feed
- Permalink
- Report Inappropriate Content
How to draw full lines in a full accumulation line chart
I am developing a QV line chart with a dimension defined as YYYY-MM from a date value and the expression defines as two counts involving moths over selected year February and months until selected next year November.
By applying "Full accumulation" the chart draws fine each value per month, but some lines stop in some month when they have no more presence in the data for the next following months. The expected and desired behaviour should be that each line started at the first month and ended at the last drawn month, but some of them don't start at the starting month or don't end at the endind date.
Is there any way to enforce QV to draw all missed points and fill the line from the start to the end ?
I have tried some options into Chart Properties without success.
Thank you very much.
J.L.Dengra
- Mark as New
- Bookmark
- Subscribe
- Mute
- Subscribe to RSS Feed
- Permalink
- Report Inappropriate Content
This is a picture of my Line Chart in which you are able to see the uncompleted lines I would like to complete.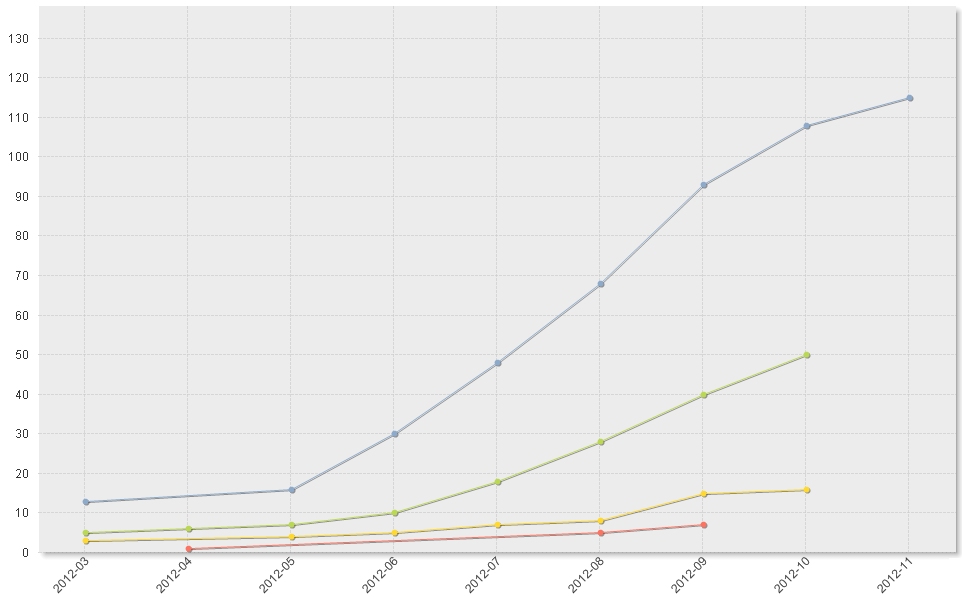
Thank you in advance for your help.