Unlock a world of possibilities! Login now and discover the exclusive benefits awaiting you.
- Qlik Community
- :
- All Forums
- :
- QlikView App Dev
- :
- Re: How to drill down and see the records of visua...
- Subscribe to RSS Feed
- Mark Topic as New
- Mark Topic as Read
- Float this Topic for Current User
- Bookmark
- Subscribe
- Mute
- Printer Friendly Page
- Mark as New
- Bookmark
- Subscribe
- Mute
- Subscribe to RSS Feed
- Permalink
- Report Inappropriate Content
How to drill down and see the records of visualizations?
I am new to Qlik. Is there anyways that we could see the records or drill down to detail of a selection in Qlik similar to drill down in Tableau or view records in PowerBI?
- Tags:
- drill down
- Mark as New
- Bookmark
- Subscribe
- Mute
- Subscribe to RSS Feed
- Permalink
- Report Inappropriate Content
Are you referring to hierarchy drill down in a chart?
-Siva
- Mark as New
- Bookmark
- Subscribe
- Mute
- Subscribe to RSS Feed
- Permalink
- Report Inappropriate Content
One option is to create drill down dimension through create master dimension. But the data needs to have some kind of hierarchy similar to Year->Quarter->Month->Week->Day.
- Mark as New
- Bookmark
- Subscribe
- Mute
- Subscribe to RSS Feed
- Permalink
- Report Inappropriate Content
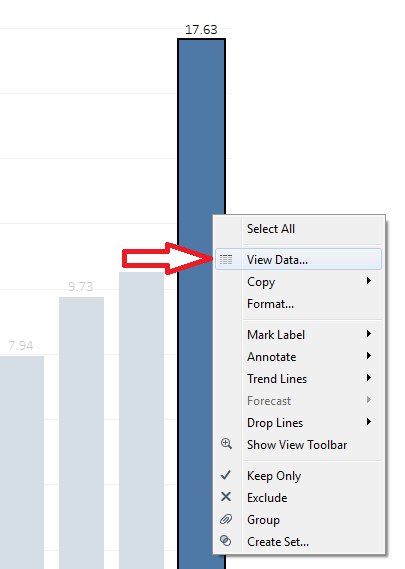
not the hierarchy drill down but the drill down to see the underlying records that make up that piece of selection. It's an extremely useful feature. I have attached the screenshot of the same feature in Tableau. I am just not sure how to see the underlying data right from the sheets in Qlik.
- Mark as New
- Bookmark
- Subscribe
- Mute
- Subscribe to RSS Feed
- Permalink
- Report Inappropriate Content
One way colud be to add one chart and use fast change to se details.
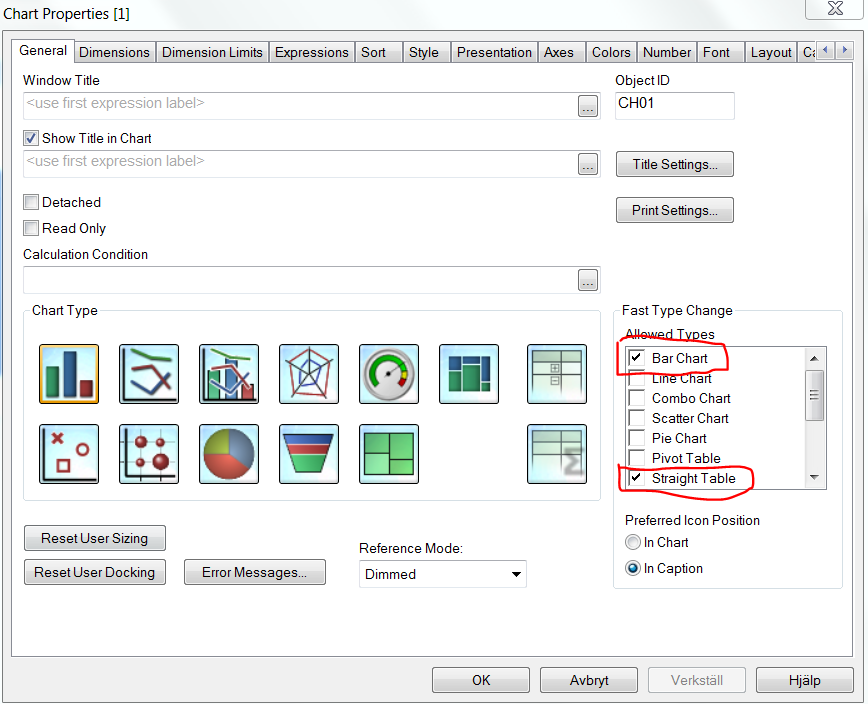
The icon here help you change view

- Mark as New
- Bookmark
- Subscribe
- Mute
- Subscribe to RSS Feed
- Permalink
- Report Inappropriate Content
sorry for my ignorance but how did you get to that chart properties in Qlik Sense?
- Mark as New
- Bookmark
- Subscribe
- Mute
- Subscribe to RSS Feed
- Permalink
- Report Inappropriate Content
ok, Sense, you should have post this in a Sense thread instead. Maybe someone else knows this.
- Mark as New
- Bookmark
- Subscribe
- Mute
- Subscribe to RSS Feed
- Permalink
- Report Inappropriate Content
got it thank you!