Unlock a world of possibilities! Login now and discover the exclusive benefits awaiting you.
- Qlik Community
- :
- All Forums
- :
- QlikView App Dev
- :
- How to evaluate the expression(which is a text fro...
- Subscribe to RSS Feed
- Mark Topic as New
- Mark Topic as Read
- Float this Topic for Current User
- Bookmark
- Subscribe
- Mute
- Printer Friendly Page
- Mark as New
- Bookmark
- Subscribe
- Mute
- Subscribe to RSS Feed
- Permalink
- Report Inappropriate Content
How to evaluate the expression(which is a text from excel) in the chart
Hi
I am having a excel sheet which has the list of fields and the corresponding expression. I have a list box with the list of the Display_Text,
I have the excel table as shown below.
| Display_Text | Field_Name | Exp_Col |
| Sales | Sales | Sum(Sales) |
| Average Sales | Sales | Avg(Sales) |
| Total Order | Order_cnt | Sum(Order_Cnt) |
| Employee Count | Emp_ID | Count(Emp_ID) |
When the user selects the Display_Text in the list box, i should be able to dynamically update the chart with the expression that is the Exo_Col.
Is this possible?
Thanks
Sarathi
Accepted Solutions
- Mark as New
- Bookmark
- Subscribe
- Mute
- Subscribe to RSS Feed
- Permalink
- Report Inappropriate Content
- Mark as New
- Bookmark
- Subscribe
- Mute
- Subscribe to RSS Feed
- Permalink
- Report Inappropriate Content
Try expression:
=$(=Exp_Col)
Update: Extra '=' sign
- Mark as New
- Bookmark
- Subscribe
- Mute
- Subscribe to RSS Feed
- Permalink
- Report Inappropriate Content
Hi Friends,
Creating a variable which holds the Exp_Col value and using the variable as $(Variable_name) solved the problem
Thanks
- Mark as New
- Bookmark
- Subscribe
- Mute
- Subscribe to RSS Feed
- Permalink
- Report Inappropriate Content
With additional '=' sign(as I updated in the earlier post), even that variable would not probably be required.
- Mark as New
- Bookmark
- Subscribe
- Mute
- Subscribe to RSS Feed
- Permalink
- Report Inappropriate Content
enclosed
- Mark as New
- Bookmark
- Subscribe
- Mute
- Subscribe to RSS Feed
- Permalink
- Report Inappropriate Content
Hi
You can create this way also
Example:-
LOAD * Inline [
Year,Month,Sales,Order_Cnt,Emp_ID
2014,1,434,23,1
2014,2,434,45,2
2014,3,545,542,3
2014,4,656,34,4
2013,4,5654,34,2
2013,5,342,343,3
2013,6,434,43,1 ];
LOAD * Inline [
Display_Text, Field_Name, Exp_Col
Sales, Sales, Sum(Sales)
Average Sales, Sales, Avg(Sales)
Total Order, Order_cnt, Sum(Order_Cnt)
Employee, Count Emp_ID, Count(Emp_ID) ];
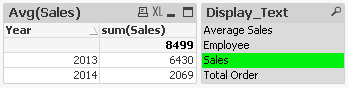
And in the chart use
And then write all the expressions as Sum(Sales), Avg(Sales), Sum(Order_Cnt) and Count(Emp_ID)
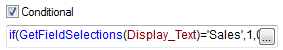
and then in conditional
=if(GetFieldSelections(Display_Text)='Sales',1,0)
=if(GetFieldSelections(Display_Text)='Average Sales',1,0)
=if(GetFieldSelections(Display_Text)='Total Order',1,0)
=if(GetFieldSelections(Display_Text)='Employee',1,0)
Regards
Anand