Unlock a world of possibilities! Login now and discover the exclusive benefits awaiting you.
- Qlik Community
- :
- All Forums
- :
- QlikView App Dev
- :
- Re: How to filter the data in expressions ?
- Subscribe to RSS Feed
- Mark Topic as New
- Mark Topic as Read
- Float this Topic for Current User
- Bookmark
- Subscribe
- Mute
- Printer Friendly Page
- Mark as New
- Bookmark
- Subscribe
- Mute
- Subscribe to RSS Feed
- Permalink
- Report Inappropriate Content
How to filter the data in expressions ?
Hi Guys,
How to filter the data in expressions ?
Below is the chart - Straight table
| Quote Name | First Date Quote | Last Date Quote | Price Movement |
|---|---|---|---|
1. Quote Name is the dimension.
2. First date Quote is expression - Max(Quote date) - 1, Bid value.
3. Last date Quote is expression - Max(Quote date), Bid value.
4. Price Movement is First Date Quote - Last Quote Date.
So query is in Price Movement i want to filter data as only value with 0.
How can i achieve the above ?
- « Previous Replies
-
- 1
- 2
- Next Replies »
- Mark as New
- Bookmark
- Subscribe
- Mute
- Subscribe to RSS Feed
- Permalink
- Report Inappropriate Content
Hi,
with conditional expressions
HTH
André Gomes
- Mark as New
- Bookmark
- Subscribe
- Mute
- Subscribe to RSS Feed
- Permalink
- Report Inappropriate Content
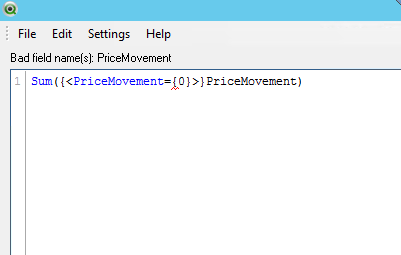
Try like this
sum({<[Price Movement]={0}>}[Price Movement])
- Mark as New
- Bookmark
- Subscribe
- Mute
- Subscribe to RSS Feed
- Permalink
- Report Inappropriate Content
Thanks for your reply.
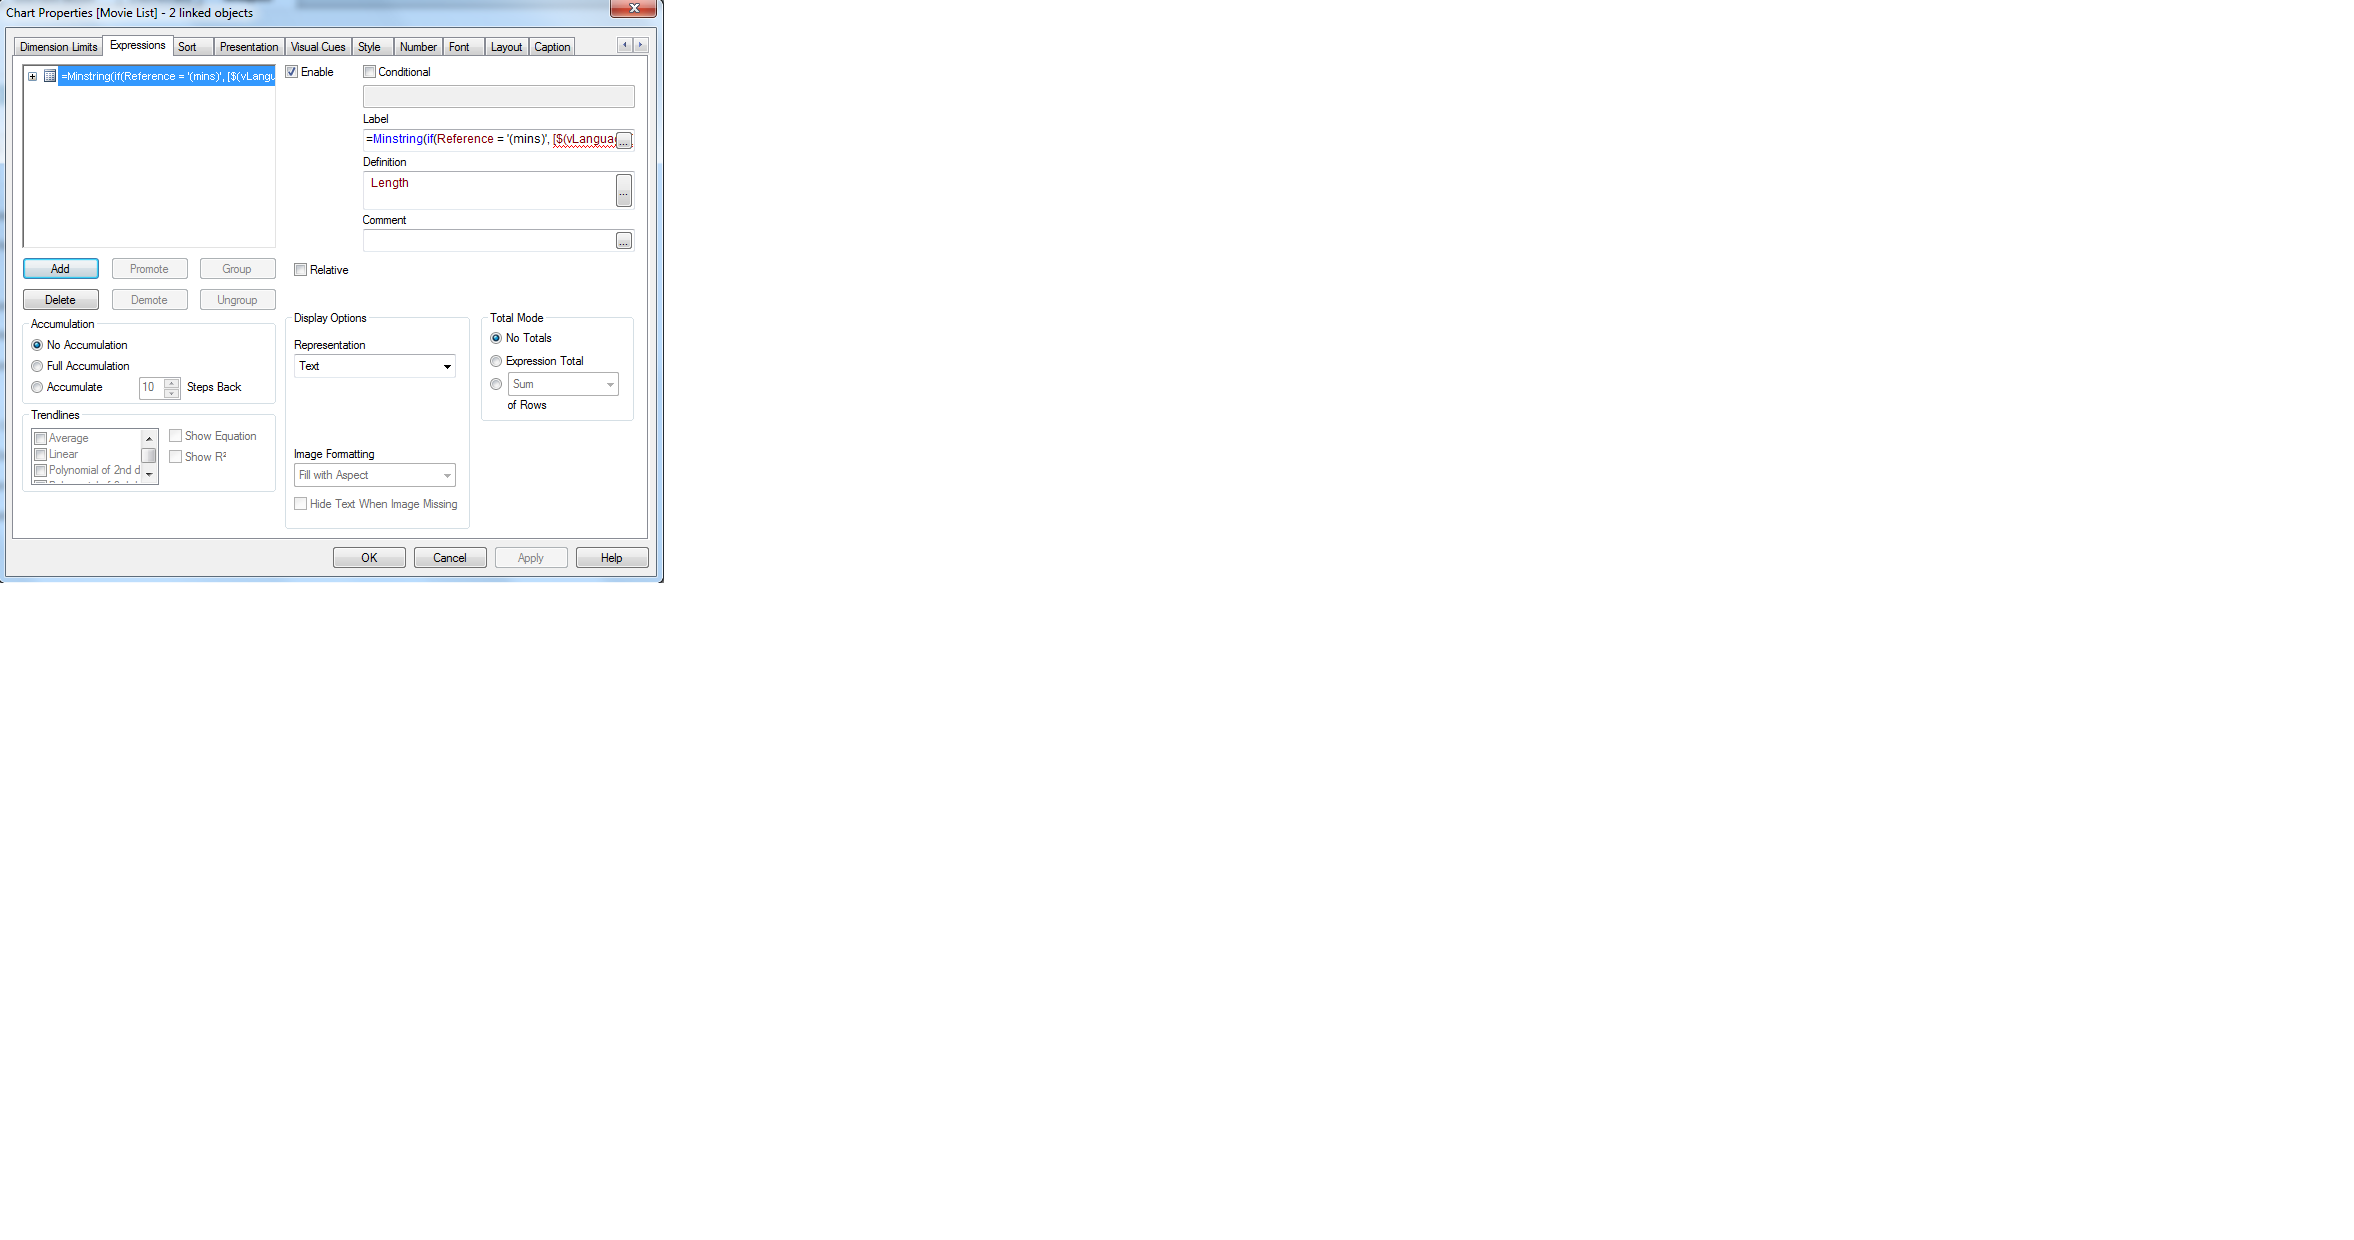
MinString also returns null value, I do not want null value in the report.
- Mark as New
- Bookmark
- Subscribe
- Mute
- Subscribe to RSS Feed
- Permalink
- Report Inappropriate Content
Thanks for your reply.
Giving error.
- Mark as New
- Bookmark
- Subscribe
- Mute
- Subscribe to RSS Feed
- Permalink
- Report Inappropriate Content
try like
if(PriceMovement=0,PriceMovement)
- Mark as New
- Bookmark
- Subscribe
- Mute
- Subscribe to RSS Feed
- Permalink
- Report Inappropriate Content
Hi,
Do you have a Field name as Price Movement?
In your expression PriceMovement is a Label and showing in blue color.
- Mark as New
- Bookmark
- Subscribe
- Mute
- Subscribe to RSS Feed
- Permalink
- Report Inappropriate Content
This also shows the null values.
I do not want null values in the report only with Price Movement as 0 to be shown.
Example:
if PriceMovement = 0 it displays 0 as PriceMovement otherwise it shows '-' in PriceMovement column.
So i dont want '-' to see.
Please help
- Mark as New
- Bookmark
- Subscribe
- Mute
- Subscribe to RSS Feed
- Permalink
- Report Inappropriate Content
Yes PriceMovement is column label name.
- Mark as New
- Bookmark
- Subscribe
- Mute
- Subscribe to RSS Feed
- Permalink
- Report Inappropriate Content
Hi Girish,
Try adding this as a calculated dimension to your chart:
=Aggr(if(FirstSortedValue([Bid Value],-[Quote Date]) - FirstSortedValue([Bid Value],-[Quote Date],2)=0,'No','Yes'),[Quote Name])
Then (hopefully) selecting 'No' in this calculated dimension will ask QV to select those values in the [Quote Name] dimension for which the Price Movement is zero.
Regards
Andrew
- « Previous Replies
-
- 1
- 2
- Next Replies »