Unlock a world of possibilities! Login now and discover the exclusive benefits awaiting you.
- Qlik Community
- :
- All Forums
- :
- QlikView App Dev
- :
- Re: How to find gap using ranks
- Subscribe to RSS Feed
- Mark Topic as New
- Mark Topic as Read
- Float this Topic for Current User
- Bookmark
- Subscribe
- Mute
- Printer Friendly Page
- Mark as New
- Bookmark
- Subscribe
- Mute
- Subscribe to RSS Feed
- Permalink
- Report Inappropriate Content
How to find gap using ranks
Hi,
I have a requirement to show revenue gap using revenue and cost ranks.. In below example, client h needs to make additional $570.9695744 to reach to no. 1 revenue rank position... formula is - 983.3415781 - 412.3720037 = 570.9695744
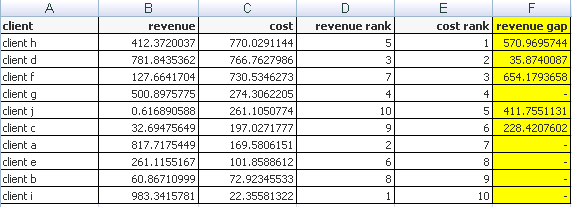
if a client's revenue rank is already better than its cost rank, then we don't need to calculate revenue gap..
Looking for any advise to build this type of chart... i don't want to pre calculate as the calculations need to happen at run time based on selected filters...
appreciate any suggestions... thanks!
- « Previous Replies
-
- 1
- 2
- Next Replies »
Accepted Solutions
- Mark as New
- Bookmark
- Subscribe
- Mute
- Subscribe to RSS Feed
- Permalink
- Report Inappropriate Content
You can generate that too if you like:
if(rank(sum(revenue))>rank(sum(cost)),
rangesum(
pick(rank(sum(cost)),
$(=concat( 'max(total aggr(sum(revenue),client),' &
num(ValueLoop(1,GetPossibleCount(client)),'00') & ')' &chr(10) ,',' ))
),
-sum(revenue)
)
)
talk is cheap, supply exceeds demand
- Mark as New
- Bookmark
- Subscribe
- Mute
- Subscribe to RSS Feed
- Permalink
- Report Inappropriate Content
IF(rank(sum(revenue),1,1) > rank(sum(cost),1,1), Max(TOTAL Aggr(SUM(revenue),client))-SUM(revenue),NULL())
- Mark as New
- Bookmark
- Subscribe
- Mute
- Subscribe to RSS Feed
- Permalink
- Report Inappropriate Content
Manish, thanks for replying..
I should have given more description on the requirement... the solution you have given will work only for client that has highest cost rank.
If you look at the 2nd example, it needs to find 2nd placed client with most revenue and find out how much more $ to make to reach to 2nd position... so in this case, formula would be - 817.7175449 - 781.8435362=35.8740087... in 3rd example, comparison should be with 3rd placed client based on revenue.
Basically, the idea is to check client's cost rank and compare against revenue rank... if client is consuming more costs than the revenue it is generating, then we need to find out how much more $ that client should make to reach to the revenue rank which will be similar to its cost rank...
- Mark as New
- Bookmark
- Subscribe
- Mute
- Subscribe to RSS Feed
- Permalink
- Report Inappropriate Content
Sorry but dont able to catch your requirements.... Can you provide solution in excel file with little more explanation?
- Mark as New
- Bookmark
- Subscribe
- Mute
- Subscribe to RSS Feed
- Permalink
- Report Inappropriate Content
Attached is the excel version... column F has the formula that shows how the gap is getting calculated...
- Mark as New
- Bookmark
- Subscribe
- Mute
- Subscribe to RSS Feed
- Permalink
- Report Inappropriate Content
Bump!
appreciate any advice...
- Mark as New
- Bookmark
- Subscribe
- Mute
- Subscribe to RSS Feed
- Permalink
- Report Inappropriate Content
See attached qvw.
talk is cheap, supply exceeds demand
- Mark as New
- Bookmark
- Subscribe
- Mute
- Subscribe to RSS Feed
- Permalink
- Report Inappropriate Content
Gysbert, thanks for the reply..
I am actually looking for a dynamic solution... dont want to precalculate the implied revenue gap as that should be recalculated based on some filters.. the example that I uploaded was for illustration purpose of the logic that I am looking for..
appreciate if you could provide any suggestions for dynamically calculating such measure at runtime..
again, thanks for taking time to look into this issue..
- Mark as New
- Bookmark
- Subscribe
- Mute
- Subscribe to RSS Feed
- Permalink
- Report Inappropriate Content
Look again. 
This time look at the chart expressions instead of at the script.
talk is cheap, supply exceeds demand
- Mark as New
- Bookmark
- Subscribe
- Mute
- Subscribe to RSS Feed
- Permalink
- Report Inappropriate Content
I should have been explicit! The solution works but the expression have hardcoding for 10 clients... my actual client list is in thousands... and filter selections changes the list of applicable clients dynamically...
correct me If I am missing something that would help me to remove below hardcoding... i liked this idea, but not able to build an expression that would dynamically pick the revenue amount based on cost rank...
if(rank(sum(revenue))>rank(sum(cost)),
rangesum(
pick(rank(sum(cost)),
$(vMax(1)),
$(vMax(2)),
$(vMax(3)),
$(vMax(4)),
$(vMax(5)),
$(vMax(6)),
$(vMax(7)),
$(vMax(8)),
$(vMax(9)),
$(vMax(10))
),
-sum(revenue)
)
)
- « Previous Replies
-
- 1
- 2
- Next Replies »