Unlock a world of possibilities! Login now and discover the exclusive benefits awaiting you.
- Qlik Community
- :
- All Forums
- :
- QlikView App Dev
- :
- How to find max value of expressions starting from...
- Subscribe to RSS Feed
- Mark Topic as New
- Mark Topic as Read
- Float this Topic for Current User
- Bookmark
- Subscribe
- Mute
- Printer Friendly Page
- Mark as New
- Bookmark
- Subscribe
- Mute
- Subscribe to RSS Feed
- Permalink
- Report Inappropriate Content
How to find max value of expressions starting from selected week?
Hi All
I have the following graph with
Dimensions: Country, GLOBAL_ITEM_ID and Yr_Wk_Frcst and I need to output the maximum value of the 2 expressions in a texbox which are active as from my max selected week (in example 2016-W5) till the max number of available weeks:
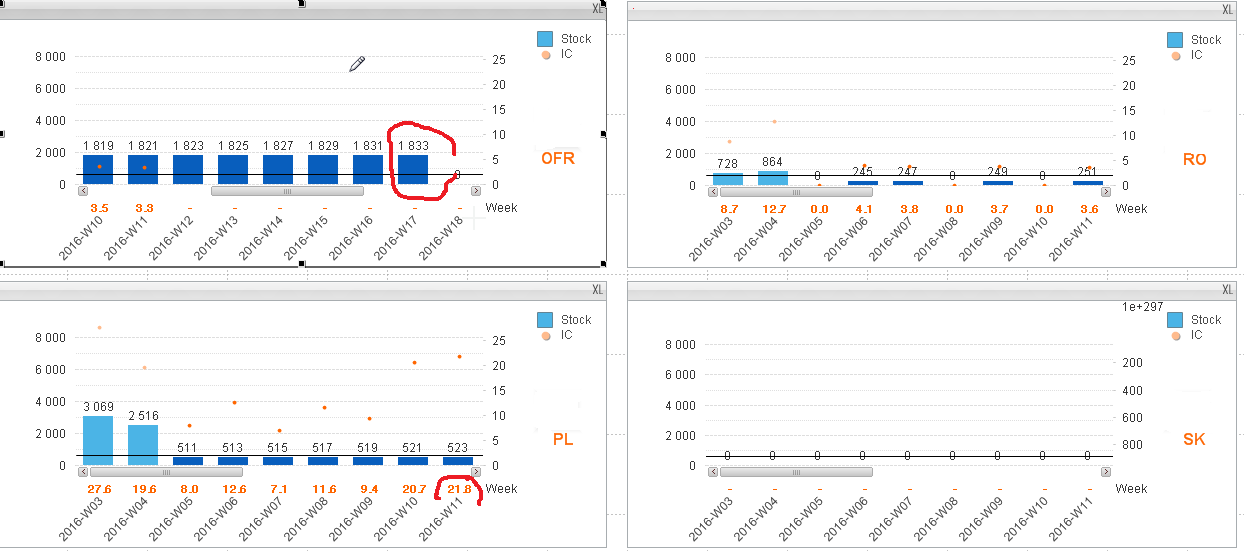
I need to edit below expression to retrieve maximum value (when I scroll the max value is 1833) of Expression number 1 active as from 2016-W5 in my example:
Sum({<Period_Week_Counter={">=$(=max(Period_Week_Counter)-2) <$(=max(Period_Week_Counter)+10)"}, Country={"France"}, ITEM_PART_NUMBER=, ITEM_NAME=, RELATED_CWH_ITEM_CODE=, GLOBAL_ITEM_ID=P(GLOBAL_ITEM_ID)>}Aggr(sum({<Period_Week_Counter={">=$(=max(Period_Week_Counter)-2) <$(=max(Period_Week_Counter)+10)"}, Country={"France"}, ITEM_PART_NUMBER=, ITEM_NAME=, RELATED_CWH_ITEM_CODE=, GLOBAL_ITEM_ID=P(GLOBAL_ITEM_ID)>}OPTIMAL_STOCK_LEVEL),GLOBAL_ITEM_ID,Yr_Wk_Frcst))
I need edit below expression to retrieve maximum value (21.8) of Expression number 2 active as from 2016-W5 in my example:
(sum({<Period_Week_Counter={">=$(=max(Period_Week_Counter)-2) <$(=max(Period_Week_Counter)+10)"}, OPE_WEK=, OPE_YY=, Country={"France"}, ITEM_PART_NUMBER=, ITEM_NAME=, RELATED_CWH_ITEM_CODE=, GLOBAL_ITEM_ID=P(GLOBAL_ITEM_ID)>}Aggr(sum({<Period_Week_Counter={">=$(=max(Period_Week_Counter)-2) <$(=max(Period_Week_Counter)+10)"}, OPE_WEK=, OPE_YY=, Country={"France"}, ITEM_PART_NUMBER=, ITEM_NAME=, RELATED_CWH_ITEM_CODE=, GLOBAL_ITEM_ID=P(GLOBAL_ITEM_ID)>}STK_QT),GLOBAL_ITEM_ID,Yr_Wk_Frcst))/sum({<Period_Week_Counter={">=$(=max(Period_Week_Counter)-2) <$(=max(Period_Week_Counter)+10)"}, OPE_WEK=, OPE_YY=, Country={"France"}, ITEM_PART_NUMBER=, ITEM_NAME=, RELATED_CWH_ITEM_CODE=, GLOBAL_ITEM_ID=P(GLOBAL_ITEM_ID)>}Aggr(sum({<Period_Week_Counter={">=$(=max(Period_Week_Counter)-2) <$(=max(Period_Week_Counter)+10)"}, OPE_WEK=, OPE_YY=, Country={"France"}, ITEM_PART_NUMBER=, ITEM_NAME=, RELATED_CWH_ITEM_CODE=, GLOBAL_ITEM_ID=P(GLOBAL_ITEM_ID)>}SHIPMENT_AVG_3_WEEKS),GLOBAL_ITEM_ID,Yr_Wk_Frcst)))*5
I need the max for all countries thereby I will remove the condition Country={"France"}
Can you please help?
- « Previous Replies
-
- 1
- 2
- Next Replies »
Accepted Solutions
- Mark as New
- Bookmark
- Subscribe
- Mute
- Subscribe to RSS Feed
- Permalink
- Report Inappropriate Content
And this:
=Max(
{<Period_Week_Counter={">=$(=max(Period_Week_Counter))"}, OPE_WEK=,OPE_YY=>}
(Aggr(Sum({<Period_Week_Counter={">=$(=max(Period_Week_Counter))"}, OPE_WEK=,OPE_YY=>}STK_QT),GLOBAL_ITEM_ID,Yr_Wk_Frcst, Country) /
Aggr(Sum({<Period_Week_Counter={">=$(=max(Period_Week_Counter))"}, OPE_WEK=,OPE_YY=>}SHIPMENT_AVG_3_WEEKS),GLOBAL_ITEM_ID,Yr_Wk_Frcst, Country)
)*5
)
- Mark as New
- Bookmark
- Subscribe
- Mute
- Subscribe to RSS Feed
- Permalink
- Report Inappropriate Content
May be this for 1st requirement
FirstSortedValue({<Period_Week_Counter={">=$(=max(Period_Week_Counter)-2) <$(=max(Period_Week_Counter)+10)"}, Country={"France"},ITEM_PART_NUMBER=, ITEM_NAME=, RELATED_CWH_ITEM_CODE=,GLOBAL_ITEM_ID=P(GLOBAL_ITEM_ID)>}
Aggr(sum({<Period_Week_Counter={">=$(=max(Period_Week_Counter)-2) <$(=max(Period_Week_Counter)+10)"}, Country={"France"}, ITEM_PART_NUMBER=, ITEM_NAME=,RELATED_CWH_ITEM_CODE=,GLOBAL_ITEM_ID=P(GLOBAL_ITEM_ID)>}OPTIMAL_STOCK_LEVEL),GLOBAL_ITEM_ID,Yr_Wk_Frcst, Country), -Aggr(Yr_Wk_Frcst, Yr_Wk_Frcst, GLOBAL_ITEM_ID, Country))
- Mark as New
- Bookmark
- Subscribe
- Mute
- Subscribe to RSS Feed
- Permalink
- Report Inappropriate Content
I don't understand the reason for getting 21.8 for the second expression. Can you elaborate? why not the value corresponding to 2016W-17?
- Mark as New
- Bookmark
- Subscribe
- Mute
- Subscribe to RSS Feed
- Permalink
- Report Inappropriate Content
THanks dear Sunny, ive tried it but its giving me null value. I think we also need to remove the -2 from the expression so that it considers only future weeks starting from my maximum selected week
- Mark as New
- Bookmark
- Subscribe
- Mute
- Subscribe to RSS Feed
- Permalink
- Report Inappropriate Content
The second expression results are displayed in color orange in the graph.
I need the maximum value which appears within the range starting from my selected week 2016-W05 (which corresponds to max of Period_Week_Counter field) till the max number of weeks present in the application.
In the example displayed, 21.8 is the maximum value of the 2nd expression shown in the graphs for all countries.
- Mark as New
- Bookmark
- Subscribe
- Mute
- Subscribe to RSS Feed
- Permalink
- Report Inappropriate Content
But isn't this the expression you are using to plot the chart?
- Mark as New
- Bookmark
- Subscribe
- Mute
- Subscribe to RSS Feed
- Permalink
- Report Inappropriate Content
Not sure though but what if you add Max(Aggr( in the beginning of above 2 expressions? Means you are aggregating all individual calculations and finding the max out of it.
- Mark as New
- Bookmark
- Subscribe
- Mute
- Subscribe to RSS Feed
- Permalink
- Report Inappropriate Content
I see what you mean, may be try this expression first (picked it from our previous discussion and made changes):
=Max({<Period_Week_Counter={">=$(=Max(Period_Week_Counter))"}, OPE_WEK=,OPE_YY=>}Aggr(Sum({<Period_Week_Counter={">=$(=max(Period_Week_Counter))"},OPE_WEK=, OPE_YY=>}STK_QT),GLOBAL_ITEM_ID,Yr_Wk_Frcst, Country))
- Mark as New
- Bookmark
- Subscribe
- Mute
- Subscribe to RSS Feed
- Permalink
- Report Inappropriate Content
And this:
=Max(
{<Period_Week_Counter={">=$(=max(Period_Week_Counter))"}, OPE_WEK=,OPE_YY=>}
(Aggr(Sum({<Period_Week_Counter={">=$(=max(Period_Week_Counter))"}, OPE_WEK=,OPE_YY=>}STK_QT),GLOBAL_ITEM_ID,Yr_Wk_Frcst, Country) /
Aggr(Sum({<Period_Week_Counter={">=$(=max(Period_Week_Counter))"}, OPE_WEK=,OPE_YY=>}SHIPMENT_AVG_3_WEEKS),GLOBAL_ITEM_ID,Yr_Wk_Frcst, Country)
)*5
)
- Mark as New
- Bookmark
- Subscribe
- Mute
- Subscribe to RSS Feed
- Permalink
- Report Inappropriate Content
To plot the graph I have three expressions:
The first one is a hidden expression which acts as a flag:
=if(Num#(Only({$<OPE_YY=, OPE_WEK=, Period_Week_Counter={">=$(=max(Period_Week_Counter)-2) <$(=max(Period_Week_Counter)+10)"}>} Yr_Wk_Frcst)) >= v_ReportWeek, 1,0)
THen my first expression displayed on the graph is based on the flag as follows:
=
if(vActivateStkMain = 1,
if(Column(1)=1,
Sum({<Period_Week_Counter={">=$(=max(Period_Week_Counter)-2) <$(=max(Period_Week_Counter)+10)"}, Country={"France"}, ITEM_PART_NUMBER=, ITEM_NAME=, RELATED_CWH_ITEM_CODE=, GLOBAL_ITEM_ID=P(GLOBAL_ITEM_ID)>}Aggr(sum({<Period_Week_Counter={">=$(=max(Period_Week_Counter)-2) <$(=max(Period_Week_Counter)+10)"}, Country={"France"}, ITEM_PART_NUMBER=, ITEM_NAME=, RELATED_CWH_ITEM_CODE=, GLOBAL_ITEM_ID=P(GLOBAL_ITEM_ID)>}OPTIMAL_STOCK_LEVEL),GLOBAL_ITEM_ID,Yr_Wk_Frcst)),
sum({<Period_Week_Counter={">=$(=max(Period_Week_Counter)-2) <$(=max(Period_Week_Counter)+10)"}, OPE_WEK=, OPE_YY=, Country={"France"}, ITEM_PART_NUMBER=, ITEM_NAME=, RELATED_CWH_ITEM_CODE=, GLOBAL_ITEM_ID=P(GLOBAL_ITEM_ID)>}Aggr(sum({<Period_Week_Counter={">=$(=max(Period_Week_Counter)-2) <$(=max(Period_Week_Counter)+10)"}, OPE_WEK=, OPE_YY=, Country={"France"}, ITEM_PART_NUMBER=, ITEM_NAME=, RELATED_CWH_ITEM_CODE=, GLOBAL_ITEM_ID=P(GLOBAL_ITEM_ID)>}STK_QT),GLOBAL_ITEM_ID,Yr_Wk_Frcst))
)
)
THen my second expression displayed on the graph is again based on the flag as follows:
=
if(vActivateICMain = 1,
if(Column(1)=1,
(Sum({<Period_Week_Counter={">=$(=max(Period_Week_Counter)-2) <$(=max(Period_Week_Counter)+10)"}, Country={"France"}, ITEM_PART_NUMBER=, ITEM_NAME=, RELATED_CWH_ITEM_CODE=, GLOBAL_ITEM_ID=P(GLOBAL_ITEM_ID)>}Aggr(sum({<Period_Week_Counter={">=$(=max(Period_Week_Counter)-2) <$(=max(Period_Week_Counter)+10)"}, Country={"France"}, ITEM_PART_NUMBER=, ITEM_NAME=, RELATED_CWH_ITEM_CODE=, GLOBAL_ITEM_ID=P(GLOBAL_ITEM_ID)>}OPTIMAL_STOCK_LEVEL), GLOBAL_ITEM_ID, Yr_Wk_Frcst)) / Aggr(sum({<Period_Week_Counter={">=$(=max(Period_Week_Counter)-2) <$(=max(Period_Week_Counter)+10)"}, OPE_WEK=, OPE_YY=, Country={"France"}, ITEM_PART_NUMBER=, ITEM_NAME=, RELATED_CWH_ITEM_CODE=, GLOBAL_ITEM_ID=P(GLOBAL_ITEM_ID)>}ForcastValue),GLOBAL_ITEM_ID,Yr_Wk_Frcst))*5,
(sum({<Period_Week_Counter={">=$(=max(Period_Week_Counter)-2) <$(=max(Period_Week_Counter)+10)"}, OPE_WEK=, OPE_YY=, Country={"France"}, ITEM_PART_NUMBER=, ITEM_NAME=, RELATED_CWH_ITEM_CODE=, GLOBAL_ITEM_ID=P(GLOBAL_ITEM_ID)>}Aggr(sum({<Period_Week_Counter={">=$(=max(Period_Week_Counter)-2) <$(=max(Period_Week_Counter)+10)"}, OPE_WEK=, OPE_YY=, Country={"France"}, ITEM_PART_NUMBER=, ITEM_NAME=, RELATED_CWH_ITEM_CODE=, GLOBAL_ITEM_ID=P(GLOBAL_ITEM_ID)>}STK_QT),GLOBAL_ITEM_ID,Yr_Wk_Frcst))/sum({<Period_Week_Counter={">=$(=max(Period_Week_Counter)-2) <$(=max(Period_Week_Counter)+10)"}, OPE_WEK=, OPE_YY=, Country={"France"}, ITEM_PART_NUMBER=, ITEM_NAME=, RELATED_CWH_ITEM_CODE=, GLOBAL_ITEM_ID=P(GLOBAL_ITEM_ID)>}Aggr(sum({<Period_Week_Counter={">=$(=max(Period_Week_Counter)-2) <$(=max(Period_Week_Counter)+10)"}, OPE_WEK=, OPE_YY=, Country={"France"}, ITEM_PART_NUMBER=, ITEM_NAME=, RELATED_CWH_ITEM_CODE=, GLOBAL_ITEM_ID=P(GLOBAL_ITEM_ID)>}SHIPMENT_AVG_3_WEEKS),GLOBAL_ITEM_ID,Yr_Wk_Frcst)))*5
)
)
- « Previous Replies
-
- 1
- 2
- Next Replies »