Unlock a world of possibilities! Login now and discover the exclusive benefits awaiting you.
- Qlik Community
- :
- All Forums
- :
- QlikView App Dev
- :
- How to freeze the end of month situation
- Subscribe to RSS Feed
- Mark Topic as New
- Mark Topic as Read
- Float this Topic for Current User
- Bookmark
- Subscribe
- Mute
- Printer Friendly Page
- Mark as New
- Bookmark
- Subscribe
- Mute
- Subscribe to RSS Feed
- Permalink
- Report Inappropriate Content
How to freeze the end of month situation
Hi,
I need something special,
Actually I always need some "now situation", but I want to implement something new, a freeze end of month situation.
Let's imagine I have a simple chart who display the number of workorder not solved.
I have 3 datetime:
- Workorder creation datetime
- Workorder predicted end date
- Workorder end date
I have a chart with month(creation datetime) dimension with this expression:
count(if(IsNull([Workorder endate],WorkOrderID)
And I get something like that:
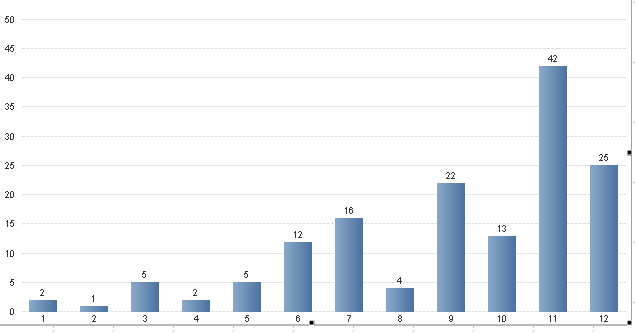
What I expect now is to get a freeze situation at the end of every month,
For example at end of January I had 35 workorder with empty workorder end date, in end of february 25, in end of March 28, etc...
Thanks you,
Fco.
- « Previous Replies
-
- 1
- 2
- Next Replies »
- Mark as New
- Bookmark
- Subscribe
- Mute
- Subscribe to RSS Feed
- Permalink
- Report Inappropriate Content
I am sorry, I don't understand what you are trying to achieve.
How do you get your 'freeze situation' numbers (January 35 etc.) from the numbers shown in your bar chart?
- Mark as New
- Bookmark
- Subscribe
- Mute
- Subscribe to RSS Feed
- Permalink
- Report Inappropriate Content
My problem is that my chart is a vision of today
My dimension is month(workorder creation date)
So, Today only 2 workorders created in January 2015 are still not achieved (end date empty)
1 workorder created in february 2015 is not achived,
5 in march,
2 in april,
...
...
...
Now, let's imagine we are the 31/01/2015 and I have 20 workorders not achieved, i need to get this number and he must never change
And i need this for every month.
January => 20
I don't know if my explanations are better now and if exist any solution... Not easy to explain
- Mark as New
- Bookmark
- Subscribe
- Mute
- Subscribe to RSS Feed
- Permalink
- Report Inappropriate Content
Is the information you want to show available in your data or historic data snapshots?
- Mark as New
- Bookmark
- Subscribe
- Mute
- Subscribe to RSS Feed
- Permalink
- Report Inappropriate Content
I have nothing in my datamodel to know directly this number, I need to find a way to found it
In simply language i need a historic data snapshot for each month with something like:
count(If((created workorder datetime<Calendar.end of month) AND workorder end date is null, workorder))
- Mark as New
- Bookmark
- Subscribe
- Mute
- Subscribe to RSS Feed
- Permalink
- Report Inappropriate Content
Maybe I misundestand what you are trying to do or what your data show, but it seems that's what you need to do:
Create snapshots of your data when reloading your data, i.e. create QVD at the end of your month that store the work orders with creation date and end date.
Then you can load your historic snapshots in and analyze how the end date changes over time.
- Mark as New
- Bookmark
- Subscribe
- Mute
- Subscribe to RSS Feed
- Permalink
- Report Inappropriate Content
I'm not sure we undestrand each other, it's not easy for me to explain in english. I will try again:
I need to rebuild what happen in the past because i only have the current situation
For example i want to know how many workorder were not closed at the end of January 2015. For that i need to look for each workorder if there was closed or not at the end of each month.
i want the count of Every workorder with a empty closed date at the end of january 2015, end of debruary, end of march
And this number never change because it's a past view.
So if I success to do this, i want to display the result on a chart.
What do you think?
- Mark as New
- Bookmark
- Subscribe
- Mute
- Subscribe to RSS Feed
- Permalink
- Report Inappropriate Content
If the information is already present in your data,then it should be possible to create the view you want to achieve.
Could you create a sample QVW that demonstrates your current data (could contain mock-up or scrambled data, but should demonstrate your current model)?
- Mark as New
- Bookmark
- Subscribe
- Mute
- Subscribe to RSS Feed
- Permalink
- Report Inappropriate Content
Hi,
Here is a simple qvw of my app with a small table with workorder number / creation date / end date.
- Mark as New
- Bookmark
- Subscribe
- Mute
- Subscribe to RSS Feed
- Permalink
- Report Inappropriate Content
Thanks swuehl, I finally solved the problem.
I created a timeline for each workorder link with my Workorder table a master Calendar link with the timeline. That allow me to check for each month how many workorder were closed or not.
Thanks for your help.
FCO.
- « Previous Replies
-
- 1
- 2
- Next Replies »