Unlock a world of possibilities! Login now and discover the exclusive benefits awaiting you.
- Qlik Community
- :
- All Forums
- :
- QlikView App Dev
- :
- Re: How to get rid of descending chart lines
- Subscribe to RSS Feed
- Mark Topic as New
- Mark Topic as Read
- Float this Topic for Current User
- Bookmark
- Subscribe
- Mute
- Printer Friendly Page
- Mark as New
- Bookmark
- Subscribe
- Mute
- Subscribe to RSS Feed
- Permalink
- Report Inappropriate Content
How to get rid of descending chart lines
Hi,
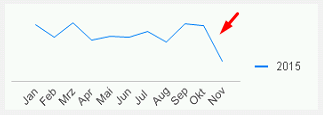
hopefully I'm able to explain, what I mean ![]()

If no period is chosen, is it possible to show only completed weeks (or in this case month) in charts to avoid these descending lines at the end which looks not very hopeful ![]()
Thanks in advance!
Oliver
- « Previous Replies
-
- 1
- 2
- Next Replies »
- Mark as New
- Bookmark
- Subscribe
- Mute
- Subscribe to RSS Feed
- Permalink
- Report Inappropriate Content
I suggest a Set Analysis statement.
Let's assume this chart is the result of the dimension Month and the expression sum(Sales). Change that expression to this:
=sum({ < Month -= {$(=month(today()))} > } Sales)
That "minus equal" (-=) thing means "take the current selection but exclude this value".
The alternative solution of course is... make more sales ![]() .
.
- Mark as New
- Bookmark
- Subscribe
- Mute
- Subscribe to RSS Feed
- Permalink
- Report Inappropriate Content
One more..
=Sum({<Month={"<=$(=Month(AddMonths(today(),-1)))"}>} Sales)
- Mark as New
- Bookmark
- Subscribe
- Mute
- Subscribe to RSS Feed
- Permalink
- Report Inappropriate Content
Thanks a lot for the quick response!
My problem with set analysis is, I don't have a single expression like "Sales".
My sales formula looks like
SUM(IF(POS_Belart_RGA = 'RuG',POS_Gesamt_Umsatz_EUR,0))+
SUM(IF(POS_Belart_RGA = 'RuG',BEL_Umsatz_Nebenkosten_1_Netto,0))+
SUM(IF(POS_Belart_RGA = 'RuG',BEL_Umsatz_Nebenkosten_2_Netto,0))+
SUM(IF(POS_Belart_RGA = 'RuG',BEL_Umsatz_Nebenkosten_3_Netto,0))+
SUM(IF(POS_Belart_RGA = 'RuG',BEL_Umsatz_Nebenkosten_4_Netto,0))+
SUM(IF(POS_Belart_RGA = 'RuG',BEL_Umsatz_Nebenkosten_5_Netto,0))
and I never was able to put this into a set analysis expression without errors.
So...
Sum({<CAL_Month={"<=$(=CAL_Month(AddMonths(today(),-1)))"}>}
SUM(IF(POS_Belart_RGA = 'RuG',POS_Gesamt_Umsatz_EUR,0))+
SUM(IF(POS_Belart_RGA = 'RuG',BEL_Umsatz_Nebenkosten_1_Netto,0))+
SUM(IF(POS_Belart_RGA = 'RuG',BEL_Umsatz_Nebenkosten_2_Netto,0))+
SUM(IF(POS_Belart_RGA = 'RuG',BEL_Umsatz_Nebenkosten_3_Netto,0))+
SUM(IF(POS_Belart_RGA = 'RuG',BEL_Umsatz_Nebenkosten_4_Netto,0))+
SUM(IF(POS_Belart_RGA = 'RuG',BEL_Umsatz_Nebenkosten_5_Netto,0)))
gives no data back.
Sorry, I'm not able to explain my problem better.
- Mark as New
- Bookmark
- Subscribe
- Mute
- Subscribe to RSS Feed
- Permalink
- Report Inappropriate Content
This looks a bit as if it could be useful to move some of these calculations to your script. It would sure help for performance and the nice side effect is that your (set analysis) expression in the front end will be a lot easier.
Worth considering?
- Mark as New
- Bookmark
- Subscribe
- Mute
- Subscribe to RSS Feed
- Permalink
- Report Inappropriate Content
Yes, I think, you're right. I tried to do the calculation in the script, but because the sales of articles and the additional costs are in different data bases, I was not able.
I tried to build an extra table (SalesTotals), but didn't get the correct results so thats my workaround which gives me the correct sales numbers.
I would be glad, to fix this issue, but I think that needs a lot more than this community is able to do without deeper insights in our data base.
Perhaps I take your answer as a motivation to try it once more ![]()
- Mark as New
- Bookmark
- Subscribe
- Mute
- Subscribe to RSS Feed
- Permalink
- Report Inappropriate Content
HI,
Try some thing like,
=Sum({<CAL_Month={"<=$(=CAL_Month(AddMonths(today(),-1)))"},POS_Belart_RGA ={ 'RuG'}>}
(POS_Gesamt_Umsatz_EUR+BEL_Umsatz_Nebenkosten_1_Netto+BEL_Umsatz_Nebenkosten_2_Netto+
BEL_Umsatz_Nebenkosten_3_Netto+BEL_Umsatz_Nebenkosten_4_Netto+BEL_Umsatz_Nebenkosten_5_Netto))
- Mark as New
- Bookmark
- Subscribe
- Mute
- Subscribe to RSS Feed
- Permalink
- Report Inappropriate Content
I tried it with our variables but get the same result
=Sum({<CAL_Month={"<=$(=CAL_Month(AddMonths(today(),-1)))"}>} POS_Gesamt_Umsatz_EUR)
- Mark as New
- Bookmark
- Subscribe
- Mute
- Subscribe to RSS Feed
- Permalink
- Report Inappropriate Content
Hi Onno,
The alternative solution of course is... make more sales .
yeah, but this would mean, we have to make more sales in the first days of this month than of the hole last month - would be great ![]()
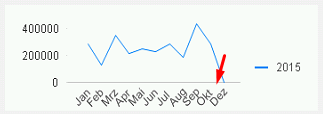
I tried your solution, it works if I select January til November. If I deselect all, I get all data except November

sum({ < CAL_Month -= {$(=month(today()))} > } POS_Gesamt_Umsatz_EUR)
- Mark as New
- Bookmark
- Subscribe
- Mute
- Subscribe to RSS Feed
- Permalink
- Report Inappropriate Content
It should be like below
=Sum({<CAL_Month={"<=$(=Month(AddMonths(today(),-1)))"}>} POS_Gesamt_Umsatz_EUR)
- « Previous Replies
-
- 1
- 2
- Next Replies »