Unlock a world of possibilities! Login now and discover the exclusive benefits awaiting you.
- Qlik Community
- :
- All Forums
- :
- QlikView App Dev
- :
- Re: How to get rid of descending chart lines
- Subscribe to RSS Feed
- Mark Topic as New
- Mark Topic as Read
- Float this Topic for Current User
- Bookmark
- Subscribe
- Mute
- Printer Friendly Page
- Mark as New
- Bookmark
- Subscribe
- Mute
- Subscribe to RSS Feed
- Permalink
- Report Inappropriate Content
How to get rid of descending chart lines
Hi,
hopefully I'm able to explain, what I mean 
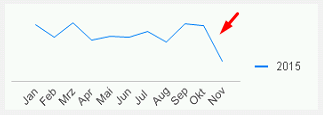
If no period is chosen, is it possible to show only completed weeks (or in this case month) in charts to avoid these descending lines at the end which looks not very hopeful 
Thanks in advance!
Oliver
- « Previous Replies
-
- 1
- 2
- Next Replies »
- Mark as New
- Bookmark
- Subscribe
- Mute
- Subscribe to RSS Feed
- Permalink
- Report Inappropriate Content
The by far simplest solution is to include a flag in your Master Calendar in the script:
If( Date < MonthStart(Today()), 1, 0 ) as IsCompletedMonth
and then use this in your Set Analysis expression:
Sum({$<IsCompletedMonth={1}>} Sales)
Just make sure that you don't show "empty" months.
HIC
- Mark as New
- Bookmark
- Subscribe
- Mute
- Subscribe to RSS Feed
- Permalink
- Report Inappropriate Content
Maybe:
Sum({<CAL_Month={"<=$(=CAL_Month(AddMonths(today(),-1)))"}, POS_Belart_RGA={'RuG'}>}
RangeSum(POS_Gesamt_Umsatz_EUR, BEL_Umsatz_Nebenkosten_1_Netto, ...., BEL_Umsatz_Nebenkosten_5_Netto))
Better if you use the IsCompletedMonth flag as Henric says.
- « Previous Replies
-
- 1
- 2
- Next Replies »