Unlock a world of possibilities! Login now and discover the exclusive benefits awaiting you.
- Qlik Community
- :
- All Forums
- :
- QlikView App Dev
- :
- Re: How to get the Set the Values Default in Line ...
- Subscribe to RSS Feed
- Mark Topic as New
- Mark Topic as Read
- Float this Topic for Current User
- Bookmark
- Subscribe
- Mute
- Printer Friendly Page
- Mark as New
- Bookmark
- Subscribe
- Mute
- Subscribe to RSS Feed
- Permalink
- Report Inappropriate Content
How to get the Set the Values Default in Line Chart with Original data Point?
Hi All,
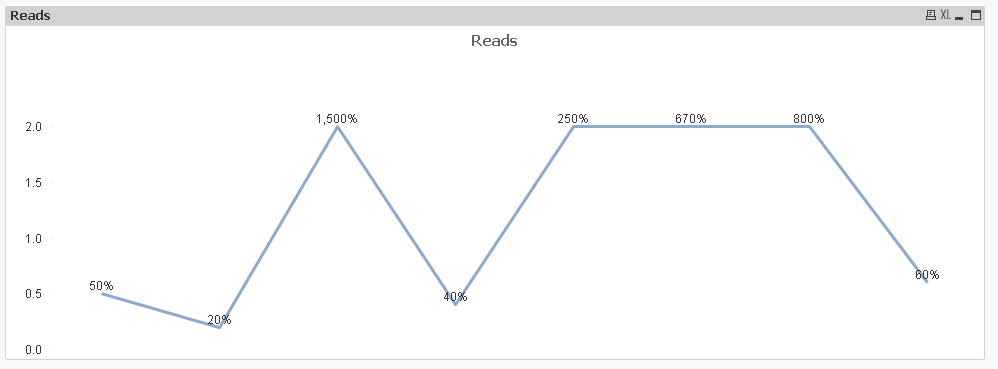
I have a Chart like below.
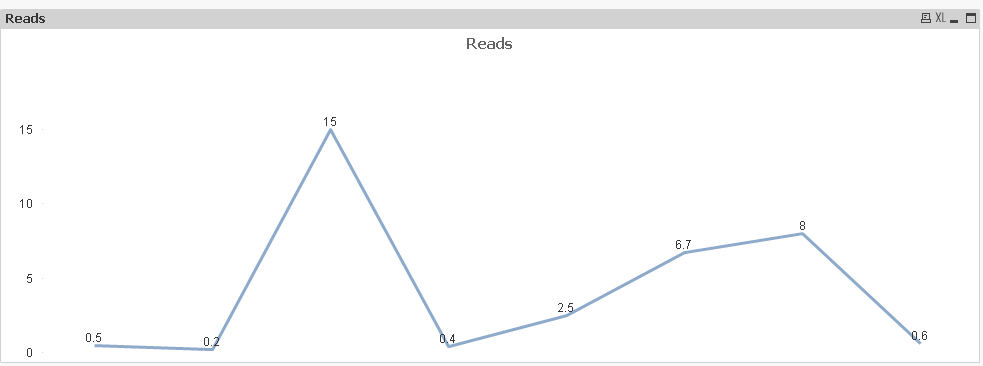
From the Above Chart, i need to Bring the value which is more than 2 to 2. But the actual value should be shown as a data point.Like below Screen Shot
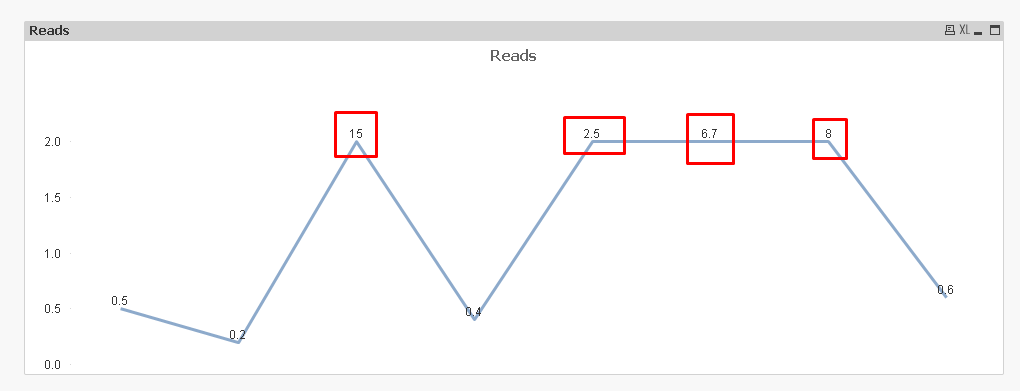
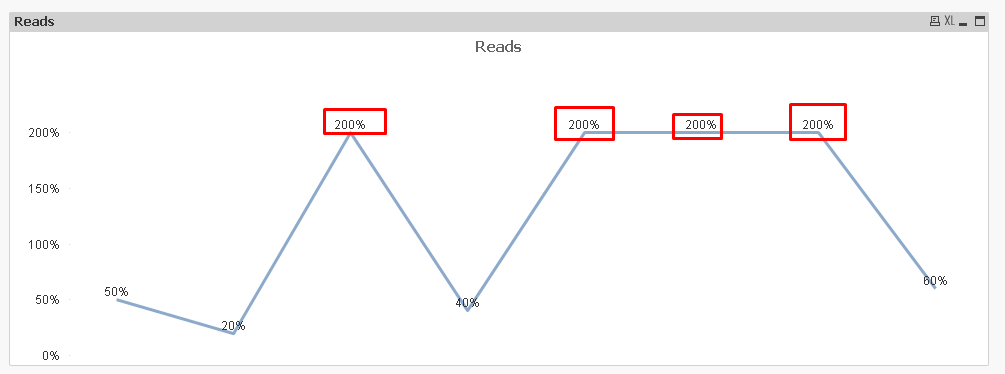
I got the above chart But when I try to convert this to Percentage(%). I am getting the data point as 200 % default. It is not showing the actual value

I Need to bring the Value Which is greater than 200% to 200%. by Showing its original value as a data Point
Please find the below attached qvw and Excel data for your reference
I need it in Expression, not in Script and also i need the out in % like above Screen Shot with Original data Points
Kindly Help me Out of this
Thanks,
Muthu
- « Previous Replies
-
- 1
- 2
- Next Replies »
Accepted Solutions
- Mark as New
- Bookmark
- Subscribe
- Mute
- Subscribe to RSS Feed
- Permalink
- Report Inappropriate Content
- Mark as New
- Bookmark
- Subscribe
- Mute
- Subscribe to RSS Feed
- Permalink
- Report Inappropriate Content
I am not sure what you are looking to get, would you try to re-explain?
- Mark as New
- Bookmark
- Subscribe
- Mute
- Subscribe to RSS Feed
- Permalink
- Report Inappropriate Content
Is this what you want?
Change the Number Format on the Number's tab to Expression Default
- Mark as New
- Bookmark
- Subscribe
- Mute
- Subscribe to RSS Feed
- Permalink
- Report Inappropriate Content
A little confused too. But is this what you're trying to get to?
- Mark as New
- Bookmark
- Subscribe
- Mute
- Subscribe to RSS Feed
- Permalink
- Report Inappropriate Content
No . I already got it. the thing is I need it in Percentage. with actual data as a data point.
when I Try to convert it into % I am getting Default as 200% for the values which i restrict to 200%
For Example:
For 3rd data Point, I need to get 1500 % but it is Showing as 200%.
For 5th data point,I need to get 250 % but it is Showing as 200%
Let Me know in case of any Doubts,
Please help me out of this.
Thanks,
Muthu
- Mark as New
- Bookmark
- Subscribe
- Mute
- Subscribe to RSS Feed
- Permalink
- Report Inappropriate Content
Use Num() function in your expression
=Dual(Num(Sum(Department), '#,##0%'),if(sum(Department)>'200%','200%',sum(Department)))
- Mark as New
- Bookmark
- Subscribe
- Mute
- Subscribe to RSS Feed
- Permalink
- Report Inappropriate Content
Yeah, this line chart values is what i want.
But Axis is Showing in Numbers I need Axis also to be Shown in %
like 0, 50%,100%,150%,200%
- Mark as New
- Bookmark
- Subscribe
- Mute
- Subscribe to RSS Feed
- Permalink
- Report Inappropriate Content
Check it out now

- Mark as New
- Bookmark
- Subscribe
- Mute
- Subscribe to RSS Feed
- Permalink
- Report Inappropriate Content
No, i want the Axis as well as values in %
- Mark as New
- Bookmark
- Subscribe
- Mute
- Subscribe to RSS Feed
- Permalink
- Report Inappropriate Content
Thank you so much sunny .This is what i except.
the above attached data is sample Data for POC .in this i can able to get the out put
but i cant able to match it with my Business that is original Data
In the Place of Num(Sum(Department), '#,##0%') i have used below Expression
=Num((Sum([TGB COUNTS])/Above(TOTAL Sum({<[File Date]>}[TGB COUNTS])) - 1)* Avg(1), '#,##0%') in
So Please Provide me a Solution for my Business(Original data)
Kindly help me
Thanks,
Muthu
- « Previous Replies
-
- 1
- 2
- Next Replies »