Unlock a world of possibilities! Login now and discover the exclusive benefits awaiting you.
- Qlik Community
- :
- All Forums
- :
- QlikView App Dev
- :
- Re: How to limit +2sd more than 100% in chart
- Subscribe to RSS Feed
- Mark Topic as New
- Mark Topic as Read
- Float this Topic for Current User
- Bookmark
- Subscribe
- Mute
- Printer Friendly Page
- Mark as New
- Bookmark
- Subscribe
- Mute
- Subscribe to RSS Feed
- Permalink
- Report Inappropriate Content
How to limit +2sd more than 100% in chart
Hi,
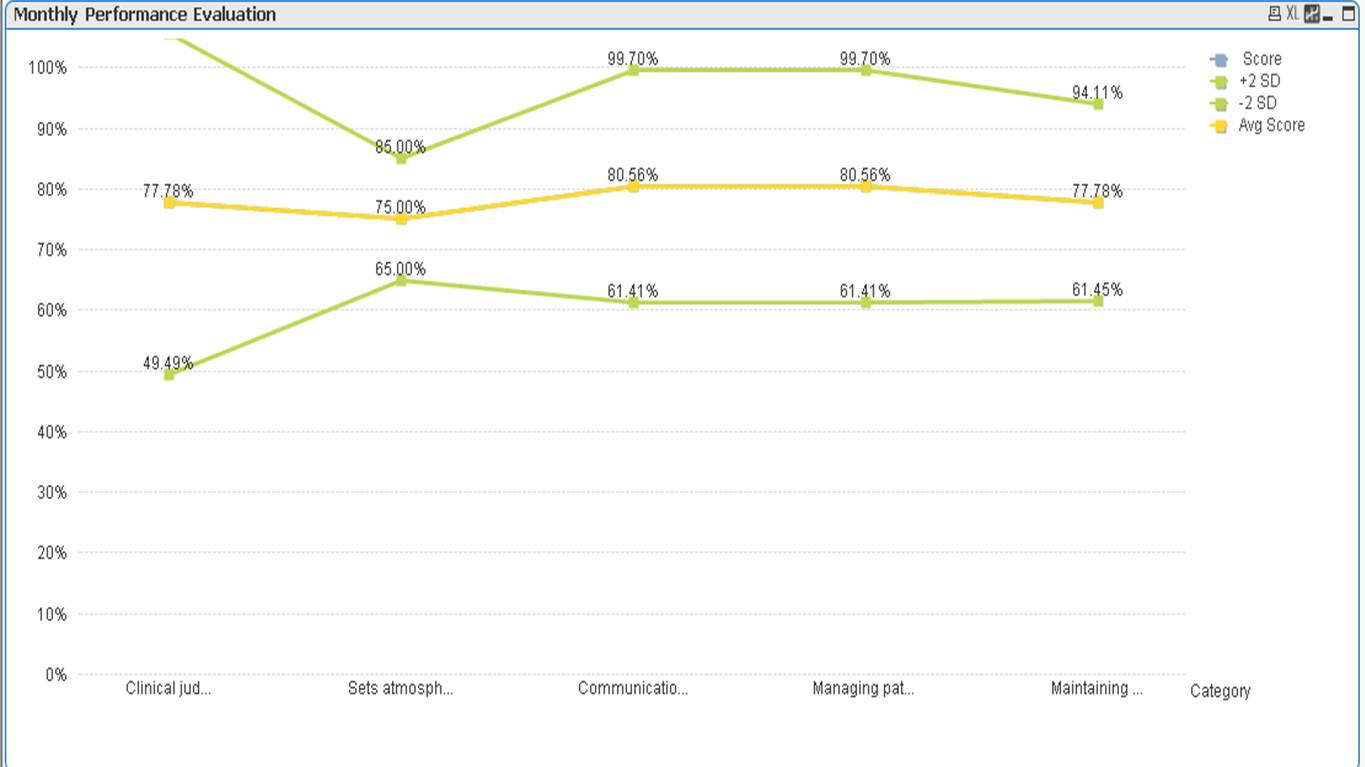
Attached is an image of the +2sd line that I have done up.

In this chart, the +2sd is more than 100%. May I know how to limit the chart if it goes more than 100%.
I wish to set the limit at 100%
my calculation = Mean + (2 * SD)
Because the 2*SD is higher than the mean, this is why it goes out of 100%.
Would need advise on this.
Thanks
Chun Wey
Accepted Solutions
- Mark as New
- Bookmark
- Subscribe
- Mute
- Subscribe to RSS Feed
- Permalink
- Report Inappropriate Content
Hi Chunwey,
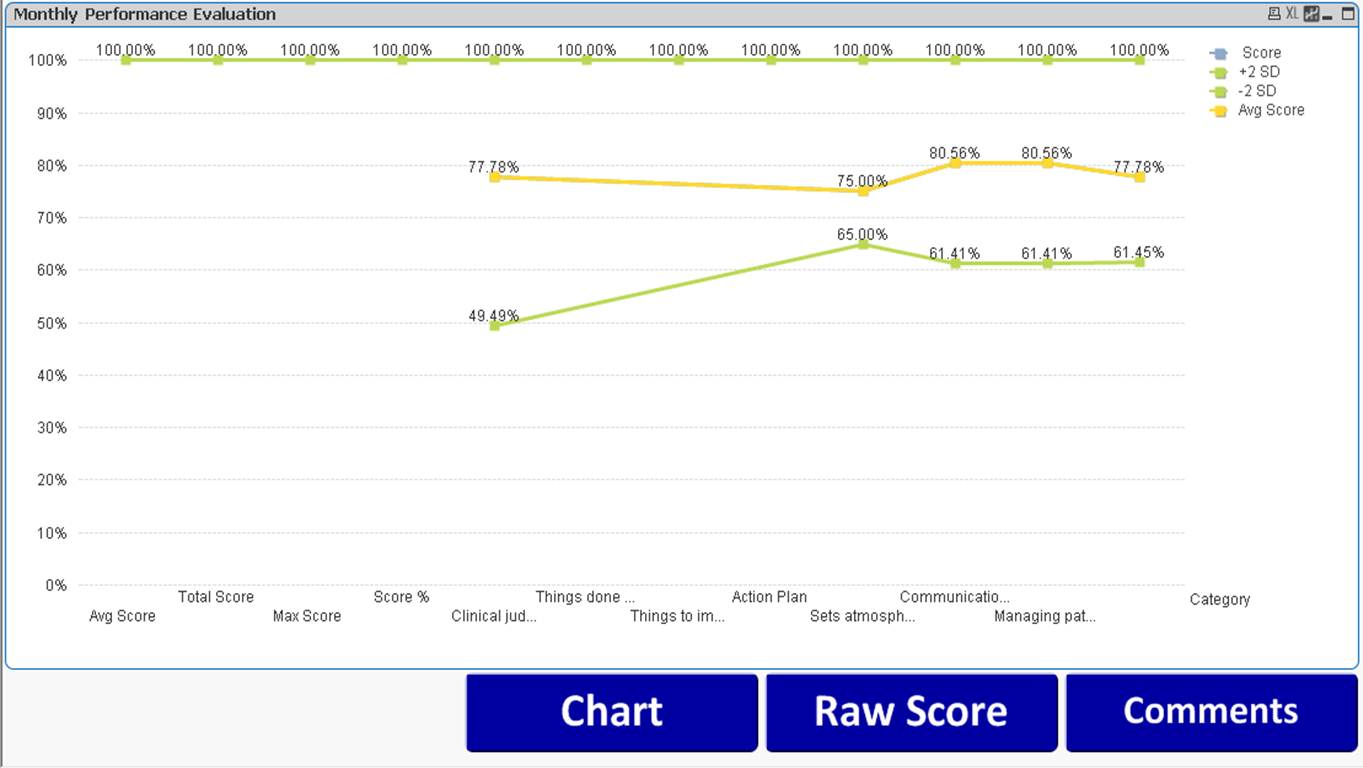
so are you just wanting any of the individual points which go above 100% to be forced to 100% instead? Something like this?
hope that helps
Joe
- Mark as New
- Bookmark
- Subscribe
- Mute
- Subscribe to RSS Feed
- Permalink
- Report Inappropriate Content
Hi Chun, is there if the max possible value is 100, you can use:
RangeMin(Mean + (2 * SD), 1)
- Mark as New
- Bookmark
- Subscribe
- Mute
- Subscribe to RSS Feed
- Permalink
- Report Inappropriate Content
Hi Ruben,
it give me all 100% including other dimensions. Or should i include set analysis as well ?

- Mark as New
- Bookmark
- Subscribe
- Mute
- Subscribe to RSS Feed
- Permalink
- Report Inappropriate Content
Hi, it's supposing to keep only the min value of your expression or 100%, not sure of what value is returning "Mean + (2 * SD)" if it's higher than 1.
Also probably needs to filter to show only values where not isnull(Mean + (2 * SD)) or change for a simplier:
If(Mean + (2 * SD)>1, 1, Mean + (2 * SD))
Again, "1" is meaning 100%, if your espression return 100 for a 100% it should be If(Mean + (2 * SD)>100, 100, Mean + (2 * SD))
Hope this helps, if not, with a sample I can give more help.
- Mark as New
- Bookmark
- Subscribe
- Mute
- Subscribe to RSS Feed
- Permalink
- Report Inappropriate Content
Hi Ruben,
Thanks for ur help!
Attached is the qvw.
Please go to Monthly Performance Tab -> Question Type ->Select FC.
You will see the issue,
Thanks again.
Chun Wey
- Mark as New
- Bookmark
- Subscribe
- Mute
- Subscribe to RSS Feed
- Permalink
- Report Inappropriate Content
goto chart properties -> axis-> static max->
here type max(expression written in +2sd)*1.2
this will set max for you chart suppose is value then it will set to 120 as max
hope this helps
- Mark as New
- Bookmark
- Subscribe
- Mute
- Subscribe to RSS Feed
- Permalink
- Report Inappropriate Content
Hi Chunwey,
so are you just wanting any of the individual points which go above 100% to be forced to 100% instead? Something like this?
hope that helps
Joe
- Mark as New
- Bookmark
- Subscribe
- Mute
- Subscribe to RSS Feed
- Permalink
- Report Inappropriate Content
Thank you, yes, this is what i want.
- Mark as New
- Bookmark
- Subscribe
- Mute
- Subscribe to RSS Feed
- Permalink
- Report Inappropriate Content
would you think 100% will be static when 2s value become 101 then it will give wrong projection.
- Mark as New
- Bookmark
- Subscribe
- Mute
- Subscribe to RSS Feed
- Permalink
- Report Inappropriate Content
Hi chauhans85,
Yes, if it is more than 100%, it is definitely wrong projection.
This is why I am limiting to 100%.
Thanks
Chun wey