Unlock a world of possibilities! Login now and discover the exclusive benefits awaiting you.
- Qlik Community
- :
- All Forums
- :
- QlikView App Dev
- :
- How to make a PIE Chart using 1 value as 100%
- Subscribe to RSS Feed
- Mark Topic as New
- Mark Topic as Read
- Float this Topic for Current User
- Bookmark
- Subscribe
- Mute
- Printer Friendly Page
- Mark as New
- Bookmark
- Subscribe
- Mute
- Subscribe to RSS Feed
- Permalink
- Report Inappropriate Content
How to make a PIE Chart using 1 value as 100%
Hello,
New QlikView user here  (and bear with me, english is not my native tongue)
I'm trying to create a Pie Chart to show the total expenses for a specific project
The fields I'm using are:
Sector: Cost:
OP1 150
OP2 200
OP3 125
OP4 500
In this example:
OP1 = construction materials
OP2 = labor
OP3 = Misc
OP4 = TOTAL REVENUE of this specific project
I get all the data from our ERP and this include the total value of the project that will be paid once it's completed
How could I create my PIE chart so each OP (1 to 3) is substracted from the total (OP4) ?
At the moment I show amounts for all fields so I got a nice incorrect chart as the "Total Revenue" should be the full amount and not another value added to the others.
Note that I need to be able to use this chart with all the projects so adding a fixed value is not possible since it will change depending wich project I select
I hope that I'm clear enough...
Thanks for your help
Accepted Solutions
- Mark as New
- Bookmark
- Subscribe
- Mute
- Subscribe to RSS Feed
- Permalink
- Report Inappropriate Content
Maybe use four expressions, similar to what Jonathan suggested:
=Sum({<Sector = {OP1}>} Amount)
=Sum({<Sector = {OP2}>} Amount)
=Sum({<Sector = {OP3}>} Amount)
=Sum({<Sector = {OP4}>} Amount) - Sum({<Sector = {OP1,OP2,OP3}>} Amount)
- Mark as New
- Bookmark
- Subscribe
- Mute
- Subscribe to RSS Feed
- Permalink
- Report Inappropriate Content
use
sum({<Sector-={OP4}>} Cost)
this will sum all cost types which selected (or all if nothing is selected) but not Sector = OP4
Regards
- Mark as New
- Bookmark
- Subscribe
- Mute
- Subscribe to RSS Feed
- Permalink
- Report Inappropriate Content
Are OP1...OP4 individual fields?
Use Sum(OP1), Sum(OP2), Sum(OP3) as expressions, and calculate the 4th slice , 'Others', with the expression
=Sum(RangeSum(OP3, -OP1, -OP2, -OP3))
- Mark as New
- Bookmark
- Subscribe
- Mute
- Subscribe to RSS Feed
- Permalink
- Report Inappropriate Content
I will check your solution but to answer your question:
OP 1 - 4 are values from the same field SECTOR
The data I work with contains all codes for expenses and revenues in this specific field.
The amounts displayed in COST contains both revenues and expenses (I should have called it AMOUNT in my example, for better clarity)
I need the whole PIE to = OP4 so I can see my expenses compared to the rest of my revenues
(sorry if the terms I'm using are not correct...)
Let's say that my client will pay 1000.- for this project (amount designed as OP4)
I should be able to show my PIE = 1000 and if I have, like in my example, 3 specific expenses, I should see 4 slices >
OP1, OP2, OP3 AND the remaining amount from OP4 (1000 - (OP1 + OP2 + OP3))
hope this helps to better understand
Thanks for your help
- Mark as New
- Bookmark
- Subscribe
- Mute
- Subscribe to RSS Feed
- Permalink
- Report Inappropriate Content
Fabien, not quite sure how this chart should look like
If you sum up OP1 to OP3, this makes 475, so there is a difference of 25 to your OP4 value. That's good for your business, I guess.
But how should your pie chart (or any other chart, in case Gysbert is looking into this) look like?
Which segments do you want to show and which value should each segment show?
- Mark as New
- Bookmark
- Subscribe
- Mute
- Subscribe to RSS Feed
- Permalink
- Report Inappropriate Content
Maybe use four expressions, similar to what Jonathan suggested:
=Sum({<Sector = {OP1}>} Amount)
=Sum({<Sector = {OP2}>} Amount)
=Sum({<Sector = {OP3}>} Amount)
=Sum({<Sector = {OP4}>} Amount) - Sum({<Sector = {OP1,OP2,OP3}>} Amount)
- Mark as New
- Bookmark
- Subscribe
- Mute
- Subscribe to RSS Feed
- Permalink
- Report Inappropriate Content
Here's my example:
'FOCD', 'FOCDST' and 'FODO' are EXPENSES (109865, 70, 37670)
'DBCD' is the total revenue of the project (266510)
I would like DBCD to be the whole PIE
the 3 other values are expenses and should be deducted from the total
So each time that we have an expense (we buy metal for example), the slice FOCD (wich in my case is the code for our orders) should grow bigger and the and the total amount should shrink to show the balance
Basically it should show
266510 - (109865 + 70 + 37670) = 118905
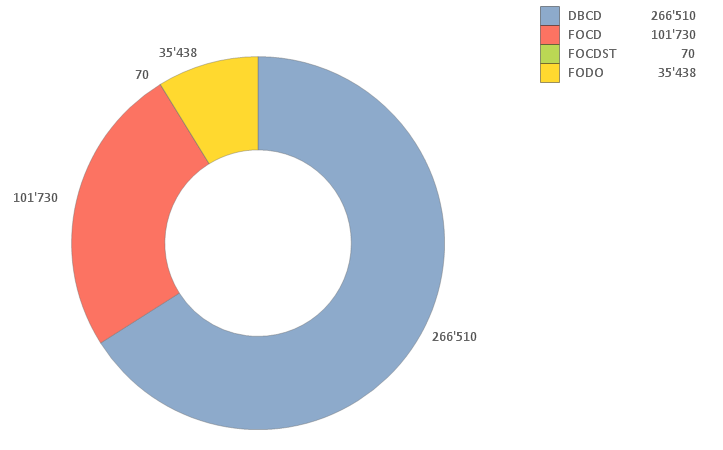
Hope this clarify...
Thanks for all your answers so far !
- Mark as New
- Bookmark
- Subscribe
- Mute
- Subscribe to RSS Feed
- Permalink
- Report Inappropriate Content
Ok, and what do you see when you are using my suggested expression?
- Mark as New
- Bookmark
- Subscribe
- Mute
- Subscribe to RSS Feed
- Permalink
- Report Inappropriate Content
It seems to do the trick !!
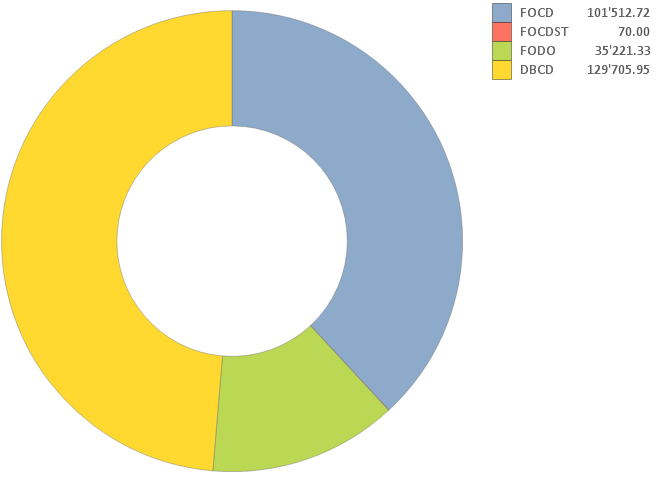
266510 - (101512 + 70 + 35221) = 129705
Thanks a lot to all who helped, I appreciate it greatly.
Have a nice week-end