Unlock a world of possibilities! Login now and discover the exclusive benefits awaiting you.
- Qlik Community
- :
- All Forums
- :
- QlikView App Dev
- :
- How to make my variance column 130.4% Green Back G...
- Subscribe to RSS Feed
- Mark Topic as New
- Mark Topic as Read
- Float this Topic for Current User
- Bookmark
- Subscribe
- Mute
- Printer Friendly Page
- Mark as New
- Bookmark
- Subscribe
- Mute
- Subscribe to RSS Feed
- Permalink
- Report Inappropriate Content
How to make my variance column 130.4% Green Back Ground change to Red ?
Hi All
I have an issue on above mentioned.
My existing expression as below :-
=If(Column(1)=0,1,(Column(2)-Column(1))/(Column(1)))
I am not sure how to modify the above expression , if the value is -ve for Column(1) , need to change the Back ground color from Green to Red.
In case Column(1) value is +ve value , there is no issue on the Back ground color.
Paul
- « Previous Replies
-
- 1
- 2
- Next Replies »
- Mark as New
- Bookmark
- Subscribe
- Mute
- Subscribe to RSS Feed
- Permalink
- Report Inappropriate Content
Hi All
Enclosed is my QV Doc.
Paul
- Mark as New
- Bookmark
- Subscribe
- Mute
- Subscribe to RSS Feed
- Permalink
- Report Inappropriate Content
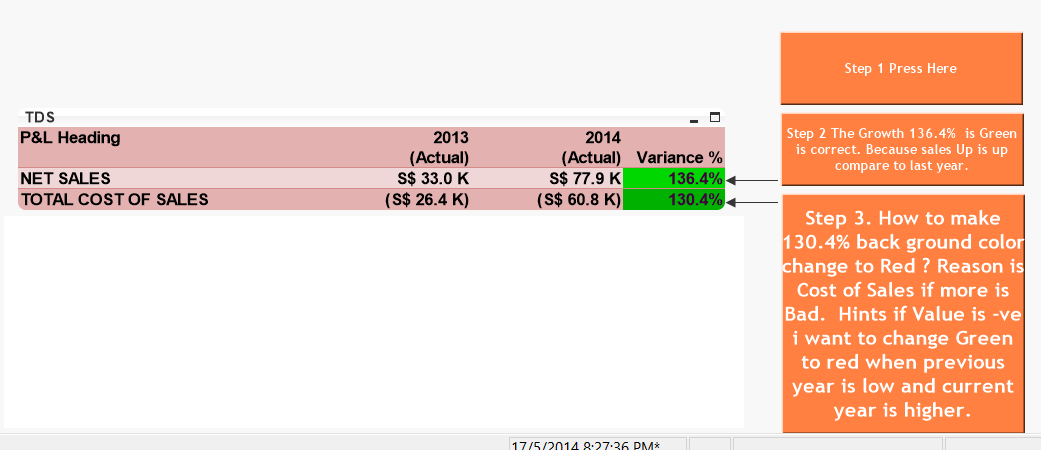
Hi All, Below is my issue , see Step 3 , i need to change the 2nd row green color to red back ground color.

- Mark as New
- Bookmark
- Subscribe
- Mute
- Subscribe to RSS Feed
- Permalink
- Report Inappropriate Content
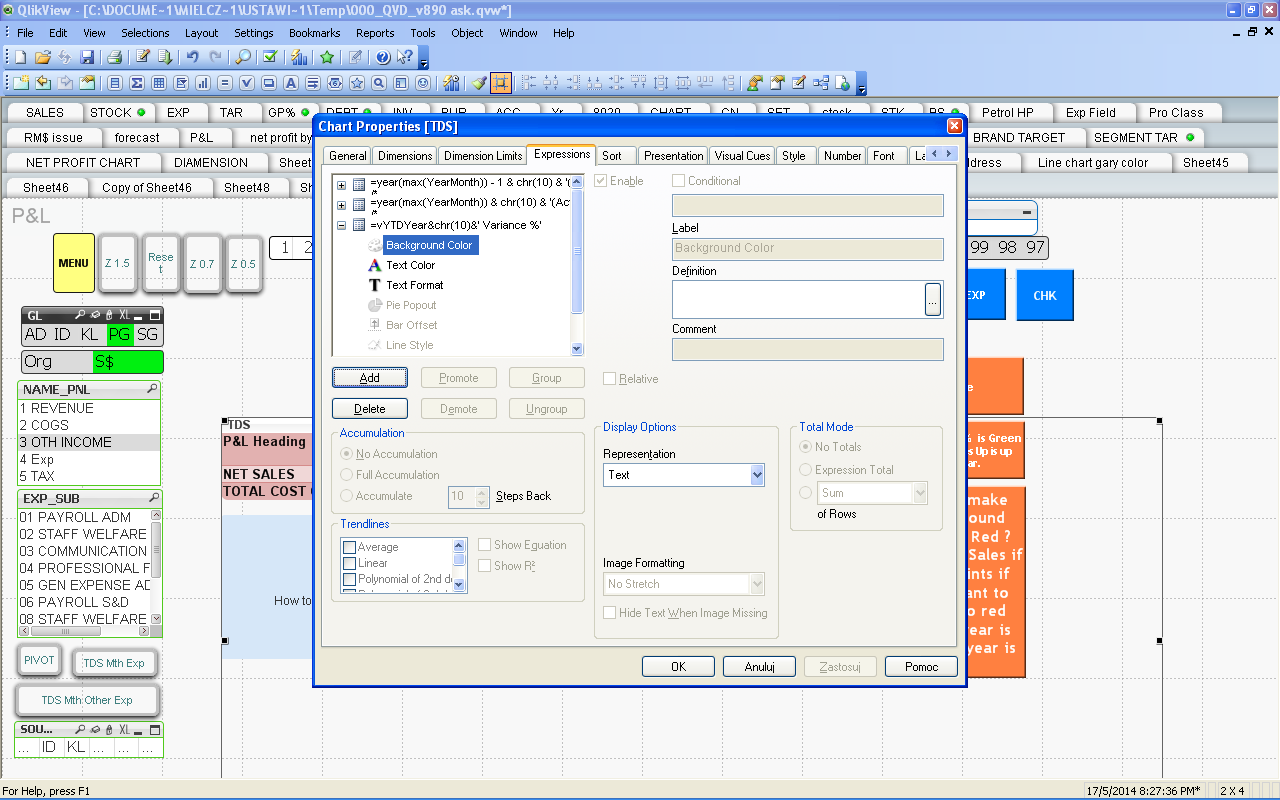
I think, you should use background color expression.

- Mark as New
- Bookmark
- Subscribe
- Mute
- Subscribe to RSS Feed
- Permalink
- Report Inappropriate Content
Hi DariusZ
Thank you for your reply. I aware of i can make use of your proposal , Any idea what expression i need to insert into back ground color ? in order to make green change to red when value is -ve ?
Paul
- Mark as New
- Bookmark
- Subscribe
- Mute
- Subscribe to RSS Feed
- Permalink
- Report Inappropriate Content
you should differentiate between P&L Heading (for some, variance should be red when column(2) is greater then column(1), for some other not)
maybe you can do in this way in background color
if(fabs(column(2)) > fabs(Column(1)) and [Exec P&L Heading_]='TOTAL COST OF SALES',Red())
or, better, add a column (RedWhen) at the same level of your P&L Heading dimension to identify if a decrement (example NET SALES, RedWhen='DECR') or an increment (COST, RedWhen='INCR') is red
in backgroundcolor
if(fabs(column(2)) > fabs(Column(1)) and RedWhen='INCR' or
fabs(column(1)) > fabs(Column(2)) and RedWhen='DECR'
,Red())
- Mark as New
- Bookmark
- Subscribe
- Mute
- Subscribe to RSS Feed
- Permalink
- Report Inappropriate Content
Paul,
wow

- Mark as New
- Bookmark
- Subscribe
- Mute
- Subscribe to RSS Feed
- Permalink
- Report Inappropriate Content
Hi Massimo
Many thank for your 2 proposal.
In my actual table. I will display all P&L items. Total can be more then 20 row.
The example I show is only 2 row . As I try not to confuse those people who try to read my table.
So I cannot add the dimension name in my expression it will be hard to maintain.
So look like I can only modify expression at variance % or back ground color. But I stuck.
Paul
Sent from Samsung Mobile
- Mark as New
- Bookmark
- Subscribe
- Mute
- Subscribe to RSS Feed
- Permalink
- Report Inappropriate Content
Hi Dari
You let all other aware my weakness ? ![]() I fail twice in create link table. So I give up. Lucky it still work after 3 yes.
I fail twice in create link table. So I give up. Lucky it still work after 3 yes.
- Mark as New
- Bookmark
- Subscribe
- Mute
- Subscribe to RSS Feed
- Permalink
- Report Inappropriate Content
Paul,
in general setting colors is easy. Look here:
Color Code based on Inline Table utilizing two dimensions in that table
Challenge Color Background dimension (on a pivot table)
Are you able put 0 or 1 as result in normal expression when red or green color condition is meet?
regards
Darek
- « Previous Replies
-
- 1
- 2
- Next Replies »