Unlock a world of possibilities! Login now and discover the exclusive benefits awaiting you.
- Qlik Community
- :
- All Forums
- :
- QlikView App Dev
- :
- Re: How to plot graphs from multiple CSV files
- Subscribe to RSS Feed
- Mark Topic as New
- Mark Topic as Read
- Float this Topic for Current User
- Bookmark
- Subscribe
- Mute
- Printer Friendly Page
- Mark as New
- Bookmark
- Subscribe
- Mute
- Subscribe to RSS Feed
- Permalink
- Report Inappropriate Content
How to plot graphs from multiple CSV files
Hey everyone,
I'm currently facing an issue with regard to plotting graph values after importing multiple CSV files and require your help to resolve it:
Objective: Import data from 20/30 CSV files and plot the data from each file on a common graph between certain axis values [Say between X and Y1].
Problem: After importing the CSV files, I only can see the plot data as one single graph which is the cumulative data from the complete imported files (Eg: Averaged data)
Expected: (For representation to show plot of axis values from multiple files )

Actual:

Any suggestions with regard to how I can obtain and plot the axis values from each file on a single graph?
Thanks a lot!!
Code: Currently, I'm only using a loop to load all the files from the Folder

- « Previous Replies
-
- 1
- 2
- Next Replies »
- Mark as New
- Bookmark
- Subscribe
- Mute
- Subscribe to RSS Feed
- Permalink
- Report Inappropriate Content
Hi Marco,
Please find attached my test result file.
Thanks.
Regards,
Suraj
- Mark as New
- Bookmark
- Subscribe
- Mute
- Subscribe to RSS Feed
- Permalink
- Report Inappropriate Content
Hi,
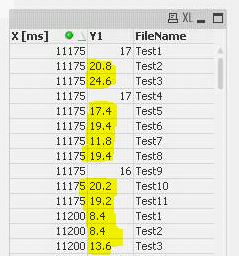
the issue in your example is not the chart properties, instead your script loads decimal values as text instead of numbers thus significantly reducing the time resolution of your chart (being limited to only the remaining integers).
I guess the shortest solution would be to change the DecimalSep variable from ',' to '.'

hope this helps
regards
Marco
- Mark as New
- Bookmark
- Subscribe
- Mute
- Subscribe to RSS Feed
- Permalink
- Report Inappropriate Content
Hi Marco,
Yes, it worked perfectly.
For a few graphs, I was getting an unexpected deviation and your explanation and solution cleared it up.
Plot - Before changing decimal separator from ',' to '.':

Plot - After changing decimal separator from ',' to '.':

Many thanks and I really appreciate all your help and support extended.
Best regards,
Suraj
- « Previous Replies
-
- 1
- 2
- Next Replies »