Unlock a world of possibilities! Login now and discover the exclusive benefits awaiting you.
- Qlik Community
- :
- All Forums
- :
- QlikView App Dev
- :
- Re: How to present rolling pipeline in QlikView?
- Subscribe to RSS Feed
- Mark Topic as New
- Mark Topic as Read
- Float this Topic for Current User
- Bookmark
- Subscribe
- Mute
- Printer Friendly Page
- Mark as New
- Bookmark
- Subscribe
- Mute
- Subscribe to RSS Feed
- Permalink
- Report Inappropriate Content
How to present rolling pipeline in QlikView?
I am trying to work on an application wherein for every month I need to show data for 3 months. eg:
Sales Month = Jan, Show sum of Pipeline for Sign Date between Jan and Mar
Sales Month = Feb, Show sum of Pipeline for Sign Date between Feb and Apr
Sales Month = Mar, Show sum of Pipeline for Sign Date between Mar and May
..... so on and so forth. There is no relation between Sales Month and Sign Date.
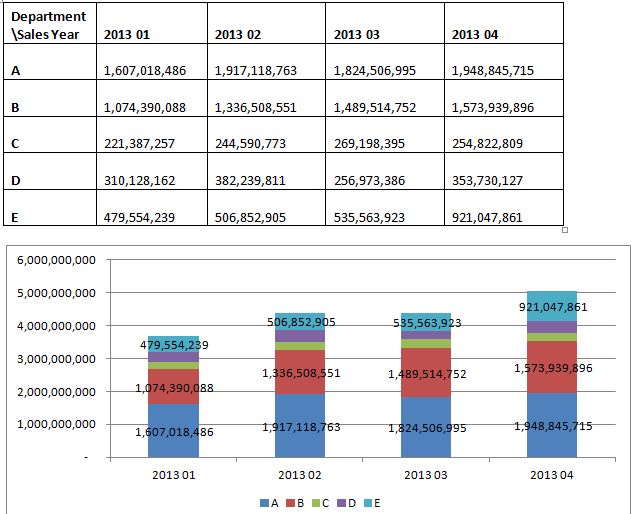
The output I am looking for from the attached QV application is attached as an image.
Thank you in advance for your help,
Dipti
- Mark as New
- Bookmark
- Subscribe
- Mute
- Subscribe to RSS Feed
- Permalink
- Report Inappropriate Content
create a link table in your script and use the new field to sum upon :
| Sales Month | Dimension |
| 201301 | 201301 |
| 201302 | 201301 |
| 201303 | 201301 |
| 201302 | 201302 |
| 201303 | 201302 |
| 201304 | 201302 |
etc...
- Mark as New
- Bookmark
- Subscribe
- Mute
- Subscribe to RSS Feed
- Permalink
- Report Inappropriate Content
Try the bellow expression...
Sum(IF([Sign Month]>= [Sales Month] and [Sign Month] <= [Sales Month]+2, Pipeline))
Thanks,
Pradeep
- Mark as New
- Bookmark
- Subscribe
- Mute
- Subscribe to RSS Feed
- Permalink
- Report Inappropriate Content
Pradeep this is a really really bad solution, if I may say so. Please read QV best practises documents where you can see why.